
Live Flight Data Step by Step - Part 9 - Contrails, and the percentage point that decides
 Stefan Koch
Part 8 ended with a number that CO₂ calculators leave out. For 2018, Lee et al. (2021) estimate the effective radiative forcing of contrail cirrus at 57.4 mW m⁻² and that of aviation’s CO₂ at 34.3 mW m⁻². The white lines behind aircraft are not a side note.
Whether an aircraft leaves one isn’t decided by the aircraft alone. It’s decided by the air it flies through: how cold, how humid. My positions don’t contain that. So this post attaches the weather at flight level to every cruise position from the same day as before – 20 October, 14:00 to 21 October, 11:59 – and applies the physics. The physics turned out to be the easy part.
Weather at 35,000 feet, for the past
Open-Meteo offers weather model data through a free API, also for past days, and on pressure levels – the way meteorologists describe altitude. 250 hPa is where the air pressure is a quarter of sea level, which in the ICAO standard atmosphere is 33,999 feet. For cruising aircraft, three levels matter: 300, 250 and 200 hPa.
One detail matters more than it seems: which weather model. Models define relative humidity differently. DWD’s ICON gives it with respect to liquid water; ECMWF’s IFS gives it with respect to ice below −23 °C. Without choosing, Open-Meteo picks a model per location. For contrails, that difference is everything, so I ask for one model explicitly – models=icon_eu:
hourly = ",".join(f"{v}_{lvl}hPa" for lvl in (300, 250, 200)
                  for v in ("temperature", "relative_humidity", "wind_speed", "wind_direction"))
r = requests.get("https://api.open-meteo.com/v1/forecast", timeout=30, params={
    "latitude": 47.0, "longitude": 8.0,
    "start_date": "2026-10-20", "end_date": "2026-10-21",
    "hourly": hourly, "models": "icon_eu"})
The cruise positions – airborne, above 20,000 feet – fall into 18 grid cells of one degree. 18 requests, 2,592 hourly values, no gaps. Then every position gets the weather of its cell, its hour and its level: below 32,000 ft the 300-hPa values, up to 37,000 ft the 250-hPa values, above that 200 hPa. All 121,792 cruise positions got weather.
What the weather looked like
At 250 hPa it was −52 °C in the median, between −54 and −48 °C. The standard atmosphere says −52.4 °C at that height – a very ordinary day. The wind was not quite ordinary: 77 to 95 km/h in the median depending on the level, up to 153 km/h at 250 hPa, mostly from the south to south-southwest. For an aircraft, that’s a headwind or tailwind of up to about 100 km/h in either direction (5th and 95th percentile: −101 and +97 km/h) – around 12 % of an airliner’s 830 km/h, which part 8’s model, fed with ground speed, didn’t know about.
Does a contrail form? Does it stay?
The physics is two questions.
Does a contrail form? The Schmidt–Appleman criterion (Schumann 1996): the hot, humid exhaust mixes with the cold ambient air. If the mixture passes through saturation over liquid water, droplets form and freeze. That happens below a threshold temperature that depends on pressure and humidity – at 250 hPa about −51 °C for completely dry air, warmer for humid air.
Does it persist? Only if the air is supersaturated with respect to ice – relative humidity over ice of 100 % or more. In drier air, the ice crystals sublimate within minutes. ICON’s humidity is over water, so it’s converted to over ice with the saturation vapour pressures of Murphy & Koop (2005). At −52 °C, ice is already saturated at about 61 % relative humidity over water. The intersection of both is what pycontrails calls the persistent contrail region.
In code, with the course’s contrail module, both are vector operations on whole columns:
pressure = cm.isa_pressure_hpa(ct["altitude_m"])
_, t_lc = cm.sac_threshold_temps(pressure, ct["rh_pct"])
ct["forms"] = ct["temp_c"] < t_lc
ct["rh_ice"] = cm.rh_water_to_ice(ct["rh_pct"], ct["temp_c"])
ct["persistent"] = ct["forms"] & (ct["rh_ice"] >= 100)
The result
Of the 121,792 cruise positions, 65 % form a contrail and 32 % leave a persistent one. Almost all of the persistent ones are in a narrow band:
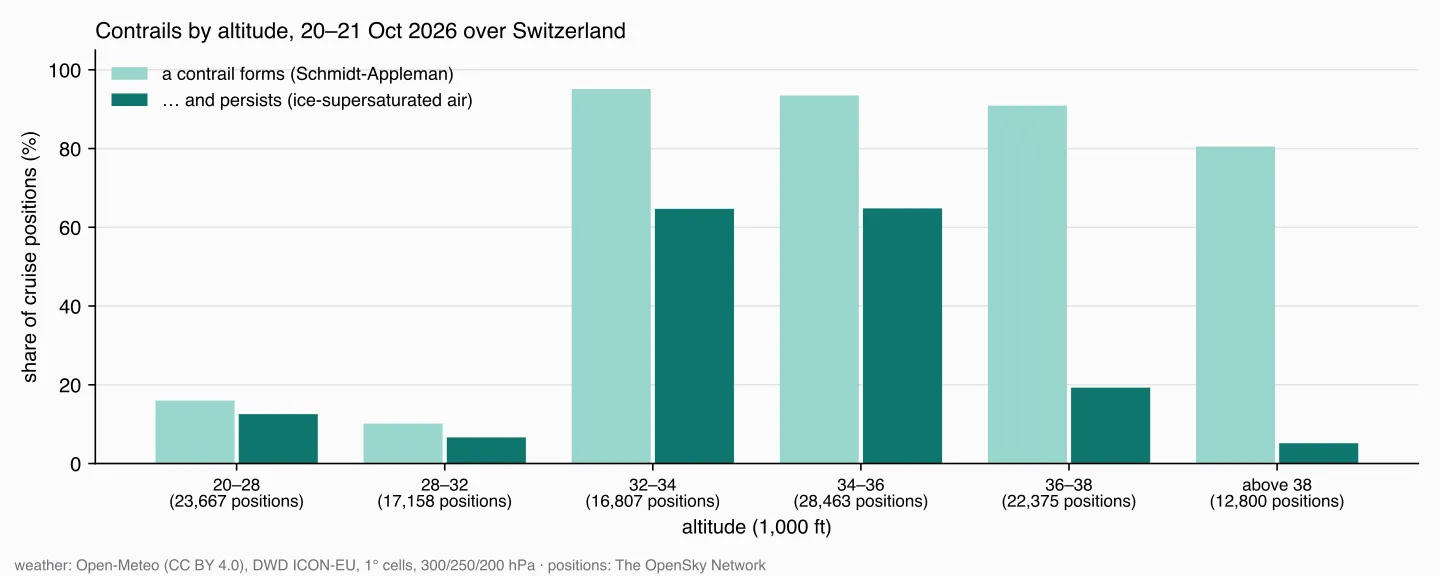
Between 32,000 and 36,000 feet, 65 % of the positions leave a persistent contrail. Above 36,000 feet the air is cold enough for contrails to form, but too dry for them to stay. Below 32,000 feet it’s mostly too warm for them to form at all. On that day there was an ice-supersaturated layer around 250 hPa, and the traffic flew right through it.
The cover image shows what that looks like from below: 20 October, 16:00 to 18:00 local time, every stretch of a track where an aircraft would have left a persistent contrail, drawn in white on a blue sky. 303 of the 507 flights in those two hours have at least one such stretch. It’s computed, not photographed – and, as the next section shows, one rounding step in the humidity would leave it far emptier.
Per flight: 2,151 of 3,677 flights at cruise altitude – 59 % – had at least one position with a persistent contrail, and 895 flights – 24 % – account for 80 % of those positions. Published studies measure the warming effect of contrails, which also depends on daylight, the ground below and how long a contrail lives; counting positions doesn’t capture that. But it does show that a quarter of the flights is where most of the effect would come from that day.
The percentage point that decides
The median humidity over ice in that layer was 101 %. One per cent above the threshold. That made me look at the raw values – and at 250 hPa, they aren’t continuous at all:
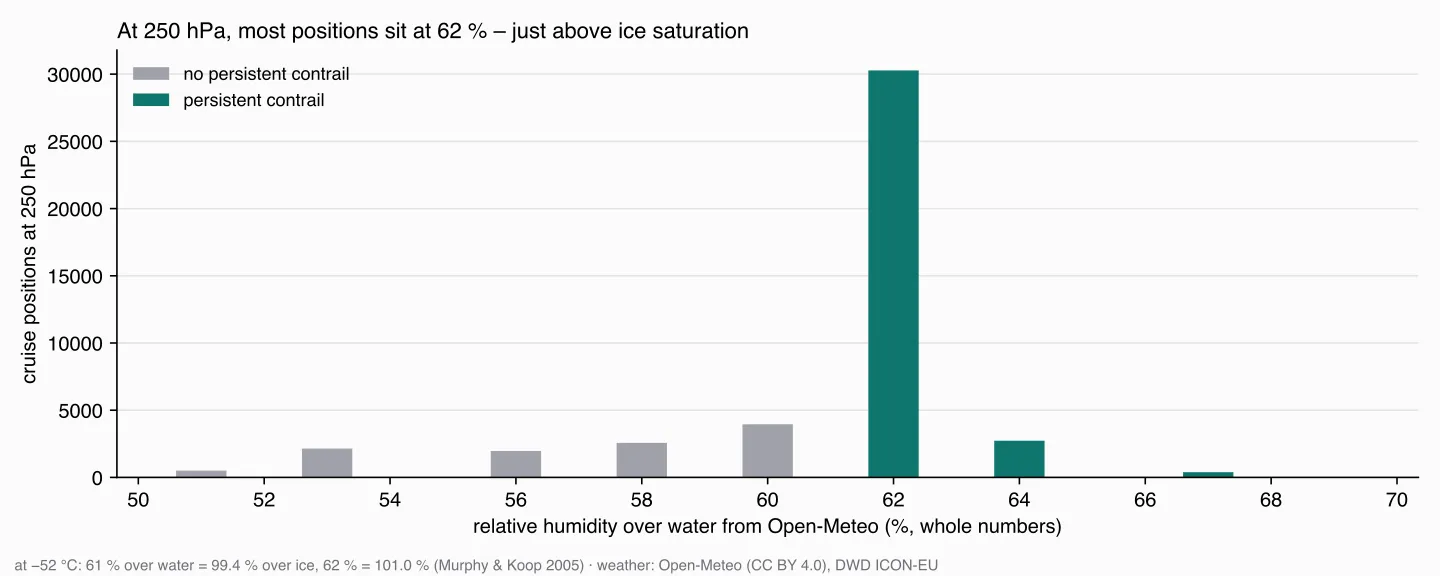
Open-Meteo returns relative humidity as whole numbers, and at 250 hPa in my data only every second or third value appears: 58, 60, 62, 64, 67 %. 30,276 positions have exactly 62 %. And 62 % sits on the edge: at −52 °C, 60 % over water is 97.7 % over ice, 61 % would be 99.4 %, and 62 % is 101.0 %. Just over the line.
So I tested what happens if the humidity were slightly different, everything else unchanged:
| Humidity over water | Contrail forms | Contrail persists |
|---|---|---|
| 10 percentage points lower | 61.8 % | 0.0 % |
| 5 percentage points lower | 62.7 % | 0.6 % |
| 2 points lower – one rounding step | 64.0 % | 3.9 % |
| 1 point lower | 64.3 % | 8.2 % |
| as delivered | 64.9 % | 31.7 % |
| 1 point higher | 65.2 % | 32.7 % |
| 2 points higher | 65.6 % | 35.7 % |
| 5 points higher | 66.7 % | 40.5 % |
| 10 points higher | 69.3 % | 47.9 % |
One rounding step lower, and a third of all cruise positions becomes fewer than 4 %. The “forms” column barely moves. The formation of contrails is robust: it depends mainly on temperature, and the temperature was clearly below the threshold. Their persistence is a knife-edge.
That isn’t a flaw in my code or in the physics. It’s what a weather model on a one-degree grid, three pressure levels and whole-number humidity can say about a layer that is exactly at ice saturation. On this day, the honest result is: contrails formed on two thirds of the cruise positions; whether a third of the positions left a persistent one or only a few percent, this data can’t tell.
Limits I know of
- Resolution: one-degree cells (about 110 × 75 km) and three levels. A supersaturated layer thinner than the distance between two levels isn’t resolved.
- Level assignment: each position gets the nearest level’s values. The app’s module interpolates between levels; the notebook – and this post – doesn’t.
- Humidity definition: ICON’s humidity is over water and converted. Another model would need another conversion.
- Engine and fuel: the threshold uses fixed constants for Jet A-1 and an engine efficiency of 0.3, the default in pycontrails.
What’s next
Nine parts in, the data has positions, routes, CO₂ and weather. The next part steps back and asks questions with all of it at once: which hours, which airlines, which routes – and what the answers are worth.
Data source
Flight data: The OpenSky Network – Matthias Schäfer, Martin Strohmeier, Vincent Lenders, Ivan Martinovic and Matthias Wilhelm. “Bringing Up OpenSky: A Large-scale ADS-B Sensor Network for Research”. In Proceedings of the 13th IEEE/ACM International Symposium on Information Processing in Sensor Networks (IPSN), pages 83–94, April 2014. doi:10.1109/IPSN.2014.6846743
Weather: Open-Meteo.com, model DWD ICON-EU, licensed under CC BY 4.0; converted to humidity over ice and aggregated by me.
Useful Links
Weather
- Open-Meteo forecast API – pressure-level variables, past days,
models - Open-Meteo licence – CC BY 4.0
Contrails
- Lee et al. (2021) – aviation’s contribution to climate forcing, 2000–2018
- Murphy & Koop (2005) – vapour pressures of ice and supercooled water
- pycontrails: persistent contrail regions – the same criterion in an open library
Related posts
- Part 8 – CO₂ – the fuel estimate that doesn’t know the wind
Related Articles

Live Flight Data Step by Step - Part 8 - How much CO₂ is flying over Switzerland?
A transponder doesn't send fuel flow. An open aircraft performance model turns type, altitude and speed into an estimate: about 8,800 tonnes of CO₂ over Switzerland in 22 hours – with a range of −18 to +24 % from one unknown alone, and a third of the traffic the model can't see.
Live Flight Data Step by Step - Part 7 - Routes, and why almost a quarter are wrong
ADS-B doesn't say where a flight is going. A free route database does – and my own positions contradict almost a quarter of its answers. How I checked 3,664 routes, and how far flights over Switzerland really deviate from the great circle.

Live Flight Data Step by Step - Part 4 - Filling the gaps from Cloudflare R2
My laptop slept, the home server didn't. How the OpenSky answers in a Cloudflare R2 bucket are organised, how a backfill fills the gaps in bronze without downloading anything twice – and what it means when two sources write into the same table.
Comments
Comments are powered by giscus. You need a GitHub account to comment.