
Live Flight Data Step by Step - Part 10 - The 37 minutes Zurich didn't take off
 Stefan Koch
Nine parts built a database: positions, silver, gold, routes, CO₂, weather. This part only asks it questions, the way the course notebook does: in SQL, one question at a time, and checking each answer before believing it.
The first question came from the news. On the afternoon of my day, Tuesday 20 October, a technical fault at Skyguide, Swiss air traffic control, stopped traffic at Zurich. The reports didn’t agree on the details, and none of them had exact times. My positions do.
For this part I use a slightly longer window than in parts 4 to 9: the Swiss feed from 19 October, 19:40 to 21 October, 11:59 local time. That covers the afternoon before the fault and two complete nights.
What the press said
aerotelegraph reported that a fault in the system that generates the controllers’ radar picture had stopped take-offs and landings at Zurich and Geneva for a short time, and that in Zurich no take-offs were possible for almost an hour from 14:15. Capacity in Swiss airspace was halved, and after the fix it was raised to 80 % for a 24-hour stabilisation phase. 20 Minuten wrote about Zurich only and gave no times.
Take-offs and landings as events
Silver has positions, not take-offs. A take-off is something that happens to a sequence of positions. My rule:
- a track is the positions of one aircraft near an airport with no gap longer than ten minutes
- a take-off is a track that starts within 5 km of the airport, below 3,000 ft, and then climbs at least 1,500 ft
- a landing is the same in reverse: a track that ends within 5 km of the airport, below 3,000 ft, after having been at least 1,500 ft higher
My first version asked for the first position to be in the phase climbing. It missed EUW3545 and DLH8C, two of the most important aircraft in this story. Their first airborne position is at runway height, with a vertical rate of −0.33 m/s, so silver calls it cruise: the same trap as the runway-height aircraft in part 6. Looking at the altitude over the whole track is more robust.
In SQL, the core is arg_min and arg_max: the value of one column at the first or last time of the track.
SELECT icao24, airport, seg,
       arg_min(snapshot_time, snapshot_time) AS t_first, arg_min(altitude_ft, snapshot_time) AS alt_first,
       arg_min(distance_km, snapshot_time)   AS d_first, max(altitude_ft)                    AS alt_max
FROM tracks
GROUP BY ALL
HAVING d_first <= 5 AND alt_first < 3000 AND alt_max > alt_first + 1500   -- a take-off
Over the whole window this finds 592 take-offs and 589 landings at Zurich. Between 07:00 and 22:00, the median gap between two take-offs with an airline callsign is 1.8 minutes.
The gap
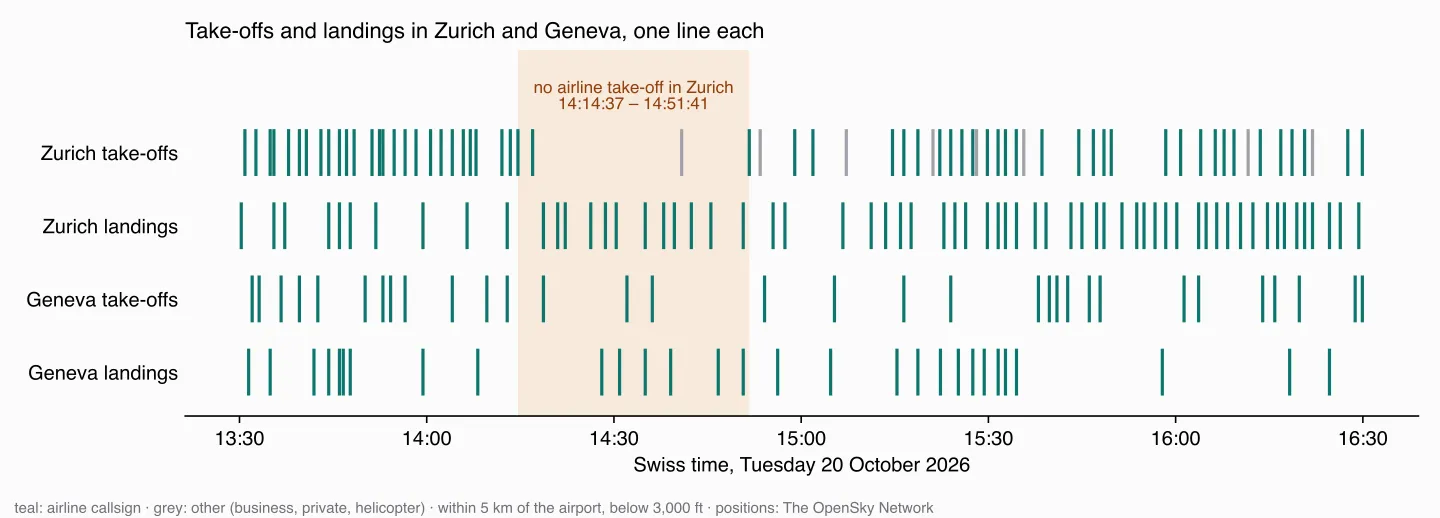
The last airliner to take off in Zurich before the gap was THY7XK, at 14:14:37. Then came a Bombardier Challenger 350 business jet at 14:16:58 and a Diamond DA40, a four-seater, at 14:40. The next airliner, EUW3545, took off at 14:51:41: 37 minutes without an airline take-off. Between 07:00 and 22:00, there’s no other gap like it. The second-longest, 22 minutes in the evening at 19:04, I can’t explain from the data.
EUW3545 itself shows what waiting looks like in the data: its transponder reported it on the ground in Zurich from 14:09:12, 42 minutes before it took off. DLH8C, the next one, was on the ground from 14:43.
“Almost an hour” fits too, depending on what you count. After EUW3545, only DLH8C took off at 15:01. Regular take-offs only started again at 15:14. Between 14:15 and 15:14, two airliners took off.
The landings didn’t stop. During the 37 minutes, 12 airliners landed in Zurich, and the longest gap between two landings between 14:00 and 15:30 was nine minutes. At least in Zurich, my data shows a stop in departures, not in arrivals.
Geneva is harder. It has fewer movements – a median of 4.7 minutes between take-offs – and in the hour after 14:15 the longest gap is 18 minutes. On the next morning, with no fault reported, there are gaps of 29 and 39 minutes. If Geneva stopped, it was too short to stand out from its normal rhythm.
The cover image shows Zurich from 12:00 to 17:00 as one turn of a clock, running clockwise: one line per take-off in the outer ring (teal) and per landing in the inner ring (orange), for every callsign in the airline format – 127 take-offs and 102 landings. The grey line right after the last airliner is the business jet. The missing piece of the outer ring, at the upper right, is the 37 minutes; the inner ring stays closed.
Did capacity drop afterwards?
The press said capacity was halved. That’s harder to see than a gap:
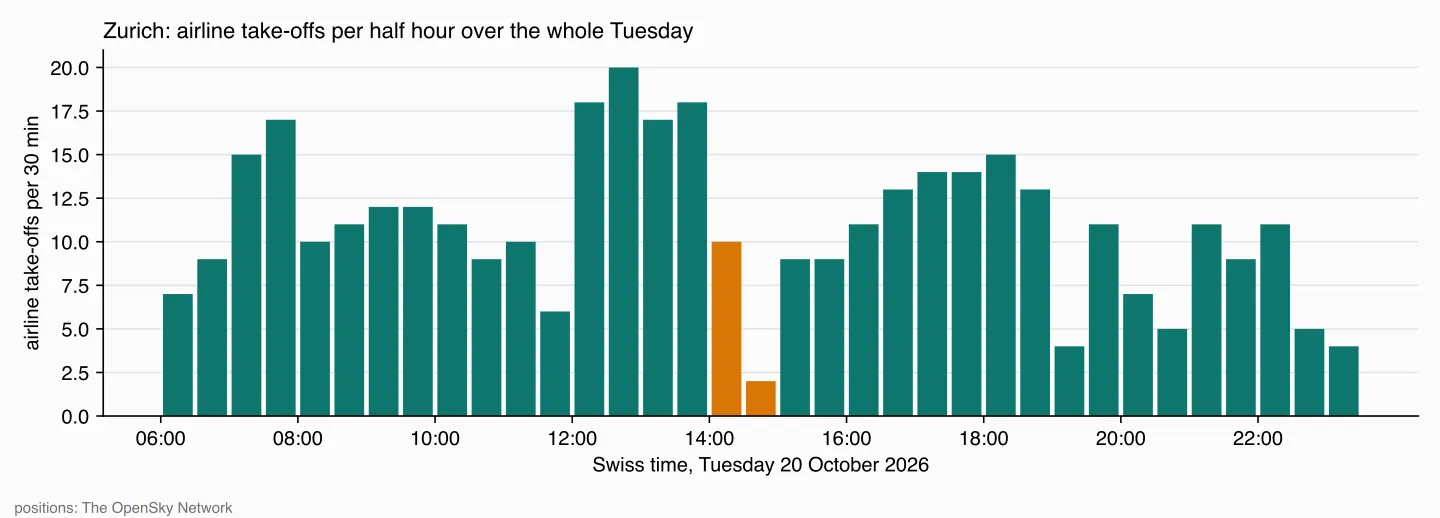
Between 15:00 and 16:00 there were 9 take-offs per half hour, against 17 to 20 at midday. But Zurich works in waves: between 08:00 and 11:30 there were only 6 to 12 per half hour, without any fault. To say whether the afternoon was slower than usual, I’d need the same Tuesday afternoon from other weeks, and I don’t have it. One day is enough to find a 37-minute gap. It’s not enough to measure a 50 % reduction.
The time zone, one more time
My first chart of this showed the drop at 12:15. The query used timezone('Europe/Zurich', snapshot_time::TIMESTAMPTZ). The cast to TIMESTAMPTZ interprets a timestamp without a time zone in the session’s time zone. The course’s connections set it to UTC; my quick scratch connection had my laptop’s, Europe/Zurich. So the UTC times were taken as Swiss times and not converted at all. The form from part 6 doesn’t depend on the session:
timezone('Europe/Zurich', timezone('UTC', snapshot_time))What happens at night
Zurich’s operating rules: regular traffic between 06:00 and 23:30, and the half hour from 23:00 is only for clearing delays. After 23:30, the airport can grant exceptions for unforeseen extraordinary events. Emergency landings, ambulance, police and disaster-relief flights aren’t restricted.
The night after the fault was a natural question: did the delays of the afternoon push flights past 23:30?
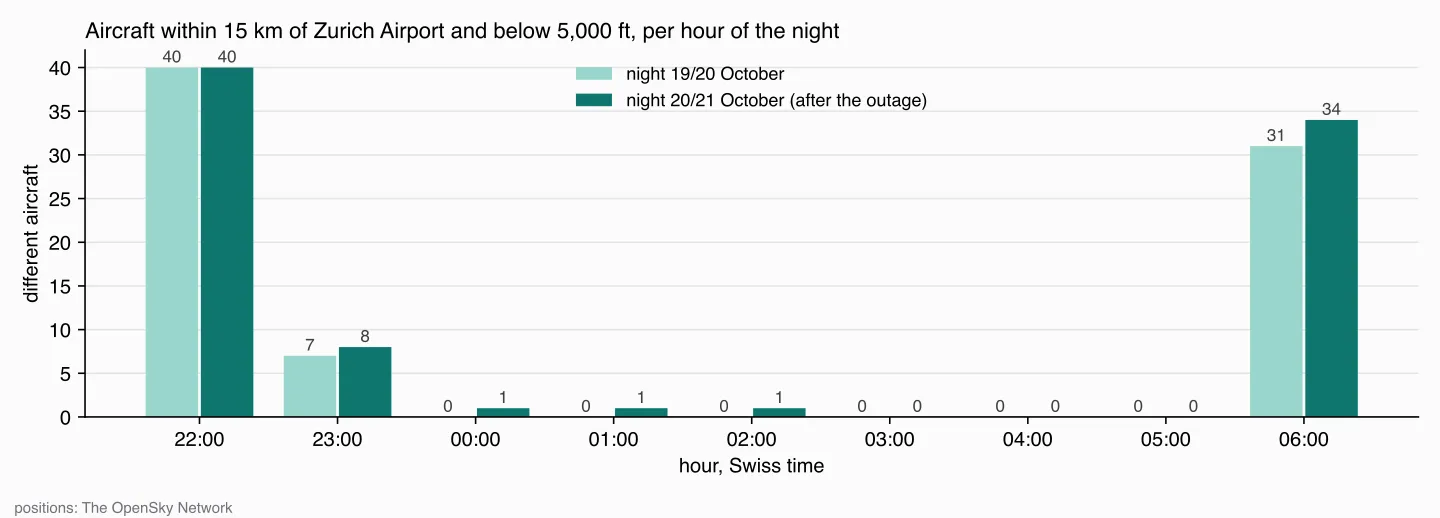
No. Both nights look almost the same. The last take-off or landing was at 23:22 and 23:18, the first in the morning at 06:01 and 06:04. Between 23:00 and 23:30 there were six movements in the first night and seven in the second. Four callsigns appear in both: SWR176, SWR92, SWR96B and IBE06CC. The same flights in the delay window two nights in a row look more like a schedule that ends shortly before 23:00 than like delays. But my data shows when the wheels left the ground, not the timetable, so I can’t check it.
Between 03:00 and 06:00, no aircraft at all was near the airport below 5,000 ft. In the second night, two were there between midnight and 02:00: RGA12 and LAS1, both with Swiss transponders, both slower than 250 km/h, between 1,600 and 3,000 ft, never closer than 8.6 km to the airport. OpenSky marks LAS1 as a rotorcraft. Neither landed or took off at Zurich.
RGA12 is also a lesson about lookups. The airline table from part 5 resolves RGA to Royal Ghanaian Airlines. In my data, 14 aircraft use 15 callsigns starting with RGA – RGA01, RGA12 and so on – all with Swiss transponders and none faster than 292 km/h. A Ghanaian airline is not a plausible answer. The numbering looks like a Swiss helicopter operator, but I didn’t find a source that confirms who it is, so the honest label is “unknown”. A join that finds a match isn’t the same as a join that finds the right one.
Landing here, or just passing through?
The course notebook answers this question with routes. After part 7, I trust the positions more. An aircraft that never came below 25,000 ft over Switzerland didn’t take off or land here. For the 2,654 aircraft of the day from parts 4 to 9:
| Lowest altitude seen | Aircraft | Positions | CO₂ estimate (part 8) |
|---|---|---|---|
| below 10,000 ft, or on the ground | 1,296 (49 %) | 71 % | 53 % |
| 10,000–25,000 ft | 181 (7 %) | 6 % | 6 % |
| never below 25,000 ft | 1,177 (44 %) | 24 % | 41 % |
44 % of the aircraft only pass through. They contribute a quarter of the positions, because at cruise speed they cross the country in minutes. But they emit 41 % of the estimated CO₂, because cruising aircraft burn more per minute than ones on the ground or on approach. Both CO₂ shares carry part 8’s caveats. Overflights are also better covered by the model – 80 % of their positions have an estimate, against 39 % for the low group, which includes every position on the ground – so this split is the one I’d trust least as a number and most as a direction.
A question this data can’t answer
The notebook also asks how old each airline’s fleet is. OpenSky’s aircraft database has a build year field. Of the 2,318 aircraft with an airline callsign that day, 67 – 2.9 % – have a value in it. An average over those says something about which entries volunteers filled in, not about fleets. The answer here is a count, not a chart.
What I take from this
The most useful result of this part is a gap of 37 minutes. It’s more exact than any report I found, and it comes from a database that was built for something else. But nearly every answer needed a second look before I believed it: the take-off rule that missed the runway, the time zone that silently shifted everything by two hours, the “Ghanaian” helicopters, a capacity reduction that one day of data can’t show. Asking a question in SQL takes a minute. Knowing whether the answer is true takes the rest of the time.
What’s next
The notebook’s routes question had a second half: could you take the train instead? Next part: plane or train, with real timetables.
Data source
Flight data: The OpenSky Network – Matthias Schäfer, Martin Strohmeier, Vincent Lenders, Ivan Martinovic and Matthias Wilhelm. “Bringing Up OpenSky: A Large-scale ADS-B Sensor Network for Research”. In Proceedings of the 13th IEEE/ACM International Symposium on Information Processing in Sensor Networks (IPSN), pages 83–94, April 2014. doi:10.1109/IPSN.2014.6846743
Airports: OurAirports, public domain. Aircraft build years: OpenSky Network aircraft database. CO₂: OpenAP, TU Delft, as in part 8.
Useful Links
The fault
- aerotelegraph, 20 October 2026 – times for Zurich and Geneva, capacity
- 20 Minuten, 20 October 2026 – the first report
Night rules
- Flughafen Zürich: Betriebszeiten – 06:00 to 23:30, the delay half hour, exceptions
DuckDB
- Aggregate functions: arg_min, arg_max – the value at the first or last time
- Timestamp with time zone functions –
timezone()and the session time zone
Related posts
- Part 5 – silver – flight phases and the airline lookup
- Part 6 – gold – the time zone conversion and the aircraft at runway height
- Part 8 – CO₂ – the estimate behind the CO₂ shares
Related Articles

Live Flight Data Step by Step - Part 8 - How much CO₂ is flying over Switzerland?
A transponder doesn't send fuel flow. An open aircraft performance model turns type, altitude and speed into an estimate: about 8,800 tonnes of CO₂ over Switzerland in 22 hours – with a range of −18 to +24 % from one unknown alone, and a third of the traffic the model can't see.
Live Flight Data Step by Step - Part 7 - Routes, and why almost a quarter are wrong
ADS-B doesn't say where a flight is going. A free route database does – and my own positions contradict almost a quarter of its answers. How I checked 3,664 routes, and how far flights over Switzerland really deviate from the great circle.

Live Flight Data Step by Step - Part 6 - Gold, and the airport that steals Zurich's arrivals
Gold answers questions: where is every aircraft right now, who is landing where, how busy is each hour? Three SQL views on silver – and why 'the nearest airport' sent 129 Zurich arrivals to an air base.
Comments
Comments are powered by giscus. You need a GitHub account to comment.