
Live Flight Data Step by Step - Part 11 - Plane or train, and what an hour is worth
 Stefan Koch
Part 10 asked the database questions about the flights themselves. This part asks one about the people in them: for how many of the flights to and from Zurich would the train have been an option – how much longer would it take, and how much CO₂ would it save?
It’s the same day as parts 4 to 9 – 20 October, 14:00 to 21 October, 11:59 – with the routes from part 7 and the aircraft types from part 8. Two new pieces of data come from outside: rail travel times and emission factors per passenger-kilometre.
Where the rail times come from
I need one number per destination: how long the train takes from Zürich HB, and with how many changes. The obvious source is the Swiss timetable, because it’s open data. opentransportdata.swiss publishes it – SBB Infrastructure runs the platform on behalf of the Federal Office of Transport – and it may be used freely as long as the source is named. There are two ways to ask it for a connection, and I tried both.
Attempt 1: the Transport API
The Transport API by Opendata.ch needs no key and computes its connections from the national timetable. One request per city:
import requests

r = requests.get("https://transport.opendata.ch/v1/connections", params={
    "from": "Zürich HB", "to": "München Hbf",
    "date": "2026-11-12", "time": "07:00", "limit": 5,
})
for c in r.json()["connections"]:
    print(c["from"]["departure"], c["duration"], c["transfers"])
I asked for all 39 cities in the course’s rail file, departures from 07:00 on Thursday 12 November. The original date, 22 October, can’t be queried any more – the API keeps only a week of past days. Out of 39:
- 13 cities without any connection: Vienna, Berlin, Hamburg, Rome, Amsterdam, Düsseldorf, Florence, Bologna, Prague, Budapest, Ljubljana, Dresden and Leipzig. Some of these stations aren’t in the data at all – “Wien Hbf” finds Worms Hbf – others are, but without a connection.
- 9 cities where the name search lands somewhere else: “London St Pancras” becomes Eglise St-Pancrace in Grimisuat, a bus stop in Valais. Hannover becomes Hänner, Nürnberg becomes Kürnberg, Köln and Graz both become Ulm Hbf.
- 17 cities with an answer. Seven of them are identical to the minute with the course file: Paris, Milan, Geneva, Lugano, Lyon, Luxembourg and Montpellier. The others differ, some by a lot: Munich 6 h 02 with three changes instead of 4 h 03 without one, Stuttgart 4 h 30 via France instead of 3 h 08. A few are faster than in the course file – Marseille, Toulouse, Brussels – which can also be the different date.
The API’s documentation says so itself: its aim is to cover public transport within Switzerland.
Attempt 2: the Open Journey Planner
opentransportdata.swiss also has the official journey planner interface, OJP 2.0. It needs a free API key, which I registered for. The request is XML, posted to https://api.opentransportdata.swiss/ojp20 with the key as a bearer token:
<OJPTripRequest>
  <Origin>
    <PlaceRef><StopPlaceRef>8503000</StopPlaceRef><Name><Text>Zürich HB</Text></Name></PlaceRef>
    <DepArrTime>2026-11-12T06:00:00Z</DepArrTime>
  </Origin>
  <Destination>
    <PlaceRef><StopPlaceRef>8020347</StopPlaceRef><Name><Text>München Hbf</Text></Name></PlaceRef>
  </Destination>
  <Params><NumberOfResults>6</NumberOfResults></Params>
</OJPTripRequest>
I tried the destinations where the Transport API had been wrong:
- Munich: only FlixBus, the fastest in 4 h 15 – not a single train. The same on 5 November, 19 November and 17 December.
- Frankfurt: 5 h 01 with two changes via France at the fastest. The course file has 4 h 06 with one change.
- Stuttgart: 4 h 30 to 4 h 40 with two changes, via France.
- Vienna and London: the location search finds neither Wien Hbf nor St Pancras.
So within Switzerland and towards France and Italy, the open Swiss data gives the same times. Towards Germany and Austria, trains are missing and the planner takes detours. For a question about flights from Zurich to Frankfurt, Munich and Vienna, that’s not usable.
What I used: the ÖBB timetable
The Austrian railways’ journey planner computes connections across Europe, including from Zürich HB. It has no official open API. The website fahrplan.oebb.at and the ÖBB app talk to a HAFAS backend at https://fahrplan.oebb.at/bin/mgate.exe, and the client identification for it is public in the ÖBB profile of the open-source hafas-client. Two requests per city – find the station, then search the trip:
import requests

MGATE = "https://fahrplan.oebb.at/bin/mgate.exe"
BASE = {"lang": "de", "ver": "1.41", "ext": "OEBB.1",
        "client": {...},   # type, id, v, name – from hafas-client p/oebb/base.js
        "auth": {...}}     # type AID and the aid – same file

def call(meth, req):
    body = {**BASE, "svcReqL": [{"meth": meth, "req": req}]}
    return requests.post(MGATE, json=body).json()["svcResL"][0]["res"]

def station(name):
    res = call("LocMatch", {"input": {"loc": {"type": "S", "name": name}, "maxLoc": 1, "field": "S"}})
    return res["match"]["locL"][0]["lid"]

trips = call("TripSearch", {
    "depLocL": [{"lid": station("Zürich HB")}],
    "arrLocL": [{"lid": station("Wien Hbf")}],
    "outDate": "20261022", "outTime": "070000", "numF": 5,
    "jnyFltrL": [{"type": "PROD", "mode": "INC", "value": "1023"}],
})
Of the first five connections from 07:00 on Thursday 22 October, the fastest one counts: travel time station to station and the number of changes. I ran it on 20 October and saved the result as a small CSV in the course: 39 cities, 48 rows, one per airport – London’s five airports all get the St Pancras time. Paris is 4 h 04 without a change, Frankfurt 4 h 06 with one, Vienna 8 h 25 with two.
Before that, I had also tried two other services without a key: the DB endpoint of transport.rest answered with HTTP 503 on every call, and the web API of bahn.de with HTTP 403.
Three things to know about these numbers:
- The endpoint is unofficial. ÖBB publishes no terms or limits for it, and it can change or be closed at any time. I queried it on one day for 39 cities and didn’t build anything that depends on it.
- It’s one weekday morning, not an average. At another time of day, on a weekend or during construction work, the fastest connection can be different.
- Where the open Swiss data is complete – within Switzerland and towards France and Italy – it gives the same times to the minute. That’s the only cross-check I have for the rest.
Which flights go somewhere the train goes?
Part 7 looked up a route for every airline callsign. Taking every combination of aircraft and callsign as one flight, my day has 4,039 flights with a route, and 581 of them start or end in Zurich according to adsbdb.
The rail side is the file from the previous section: the fastest ÖBB connection from Zürich HB to 39 cities, one row per airport.
Joining the two is one query – the other airport of each Zurich flight, matched against the cities in the rail file:
WITH zrh AS (
    SELECT s.icao24, s.callsign,
           CASE WHEN r.origin_icao = 'LSZH' THEN r.destination_icao ELSE r.origin_icao END AS airport_icao
    FROM seen s JOIN silver.flight_routes r USING (callsign)
    WHERE r.origin_icao = 'LSZH' OR r.destination_icao = 'LSZH')
SELECT t.city, COUNT(*) AS flights, ANY_VALUE(t.rail_minutes) AS rail_minutes, ...
FROM zrh z JOIN rail_times t USING (airport_icao)
GROUP BY ALL ORDER BY flights DESC
257 of the 581 Zurich flights – 44 % – go to or come from 29 cities in the rail file. The most frequent: London with 27 flights on three airports, Frankfurt 20, Berlin 17, Vienna 16, Paris 15, Rome 14 and Geneva 13.
Part 7 is a reason to be careful with these routes. Of the 257, my positions confirm 97 and contradict 21; the rest can’t be checked, typically because I see neither the take-off nor the landing at the other end. Leaving out the 35 Zurich flights whose route is contradicted, 236 of 546 go to a rail city – 43 % instead of 44 % – and the CO₂ saving further down stays at 87 %. So I keep all of them and say so.
How much longer by train?
A rail time from city centre to city centre isn’t comparable with a flight time. For the plane, the course notebook estimates the door-to-door time like this:
- Block time: 45 minutes plus the distance at 800 km/h. That gives 81 minutes for Zurich–Paris CDG.
- Airport overhead: 120 minutes for getting to the airport, security, boarding and baggage.
Both numbers are assumptions, not measurements. The train gets no overhead at all, which favours it a little: getting to Zürich HB takes time too, but less than getting to the airport and through it.
With these assumptions, the difference is:
| City | Flights | Train | Plane, door to door | Train longer by |
|---|---|---|---|---|
| Genève | 13 | 2 h 51 | 3 h 02 | −11 min |
| Stuttgart | 5 | 3 h 08 | 2 h 56 | 12 min |
| Milano | 7 | 3 h 12 | 3 h 00 | 12 min |
| Paris | 15 | 4 h 04 | 3 h 21 | 43 min |
| München | 9 | 4 h 03 | 3 h 05 | 58 min |
| Frankfurt | 20 | 4 h 06 | 3 h 06 | 60 min |
| Wien | 16 | 8 h 25 | 3 h 30 | 4 h 55 |
| London | 27 | 8 h 16 | 3 h 44 | 4 h 32 |
To Geneva, the train is faster. To five more cities, it takes at most an hour longer. Those six cities account for 69 of the 581 Zurich flights – 12 %. After that, the gap grows quickly: two hours for Düsseldorf, three and a half for Rome, between four and five for Berlin, Amsterdam, London and Vienna.
The cover image shows the same on a map: one arc from Zurich to each of the 32 airports, thicker for more flights. The teal ones are the six cities where the train takes at most an hour longer – Geneva, Milan, Stuttgart, Munich, Frankfurt and Paris. All the others are orange.
CO₂ per person
The emission factors are the Swiss mobitool factors v3.1 (EnergieSchweiz, PSI): grams of CO₂-equivalent per passenger-kilometre, over the life cycle – fuel or electricity, its production, the vehicle, maintenance and infrastructure. A flight within Europe is 319 g, a car of the Swiss fleet average 186 g per person with 1.6 people in it, a train between 7 g in Switzerland and 60 g for Italian high-speed trains.
Each mode gets its own distance – the great circle times 1.05 for the plane and times 1.2 for train and car, which can’t go in a straight line. Again assumptions; part 7 measured a median detour of 35 km over Switzerland.
co2_trip["plane_kg"] = co2_trip["distance_km"] * 1.05 * FACTOR["plane_europe"] / 1000
co2_trip["train_kg"] = co2_trip["distance_km"] * 1.2 * train_g / 1000   # factor of the destination country
co2_trip["car_kg"]   = co2_trip["distance_km"] * 1.2 * FACTOR["car_fleet_average"] / 1000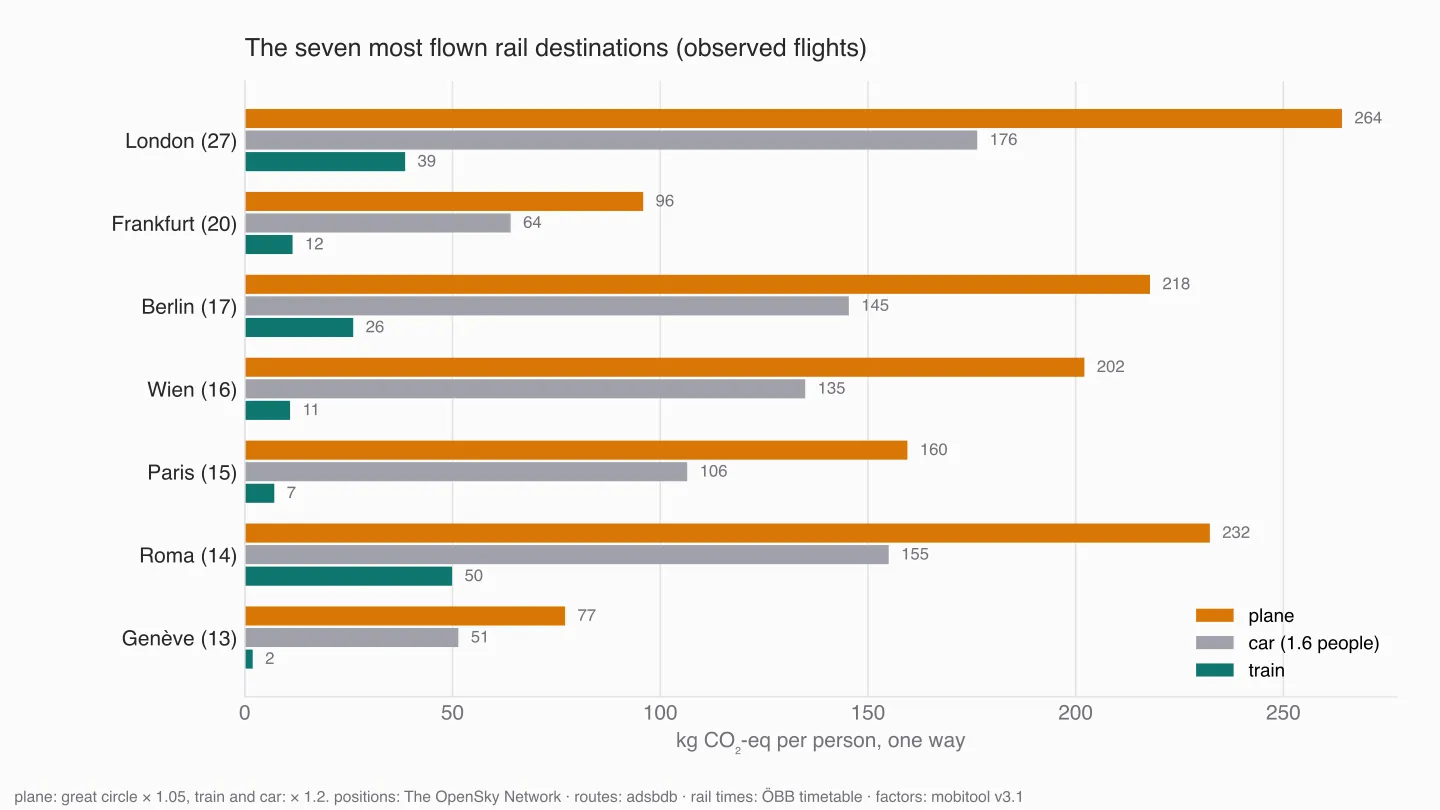
Frankfurt: 96 kg by plane, 64 by car, 12 by train, per person and one way. Paris: 160, 106 and 7 – mobitool’s factor for the French TGV is 12.5 g, lower than for any train outside Switzerland in the table. If one passenger on each of the 257 flights had taken the train instead, that’s 5.9 instead of 45.7 tonnes: 87 % less.
The train factor is a simplification. The whole trip gets the factor of the destination country, so the Swiss part of a trip to Milan counts at Italian rather than Swiss values. And mobitool has train factors for Switzerland, Germany, France, Italy and Austria only; London, Amsterdam, Brussels and the others get the German average as a stand-in.
What one hour on the train saves
The two results together are the actual trade-off: how much time do I give up, and what does it buy?
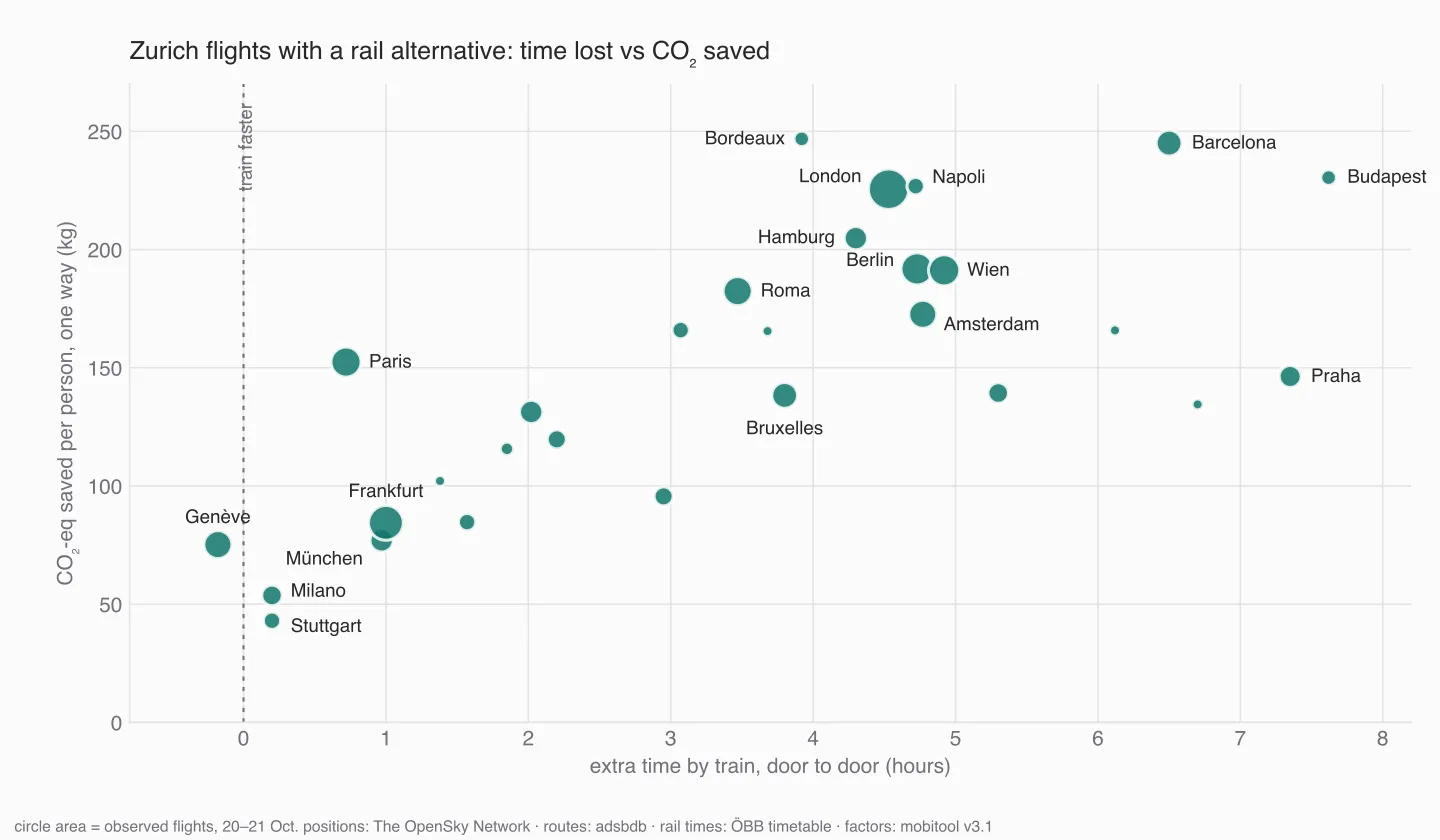
Divided, it’s kilograms of CO₂ per hour of extra travel time. Milan: 269 kg per hour. Stuttgart 215, Paris 212. Frankfurt and Munich only about 80, because the flight is short and the extra hour is a full one. For Vienna it’s 39 kg per hour, for Prague 20.
Paris, Milan and Stuttgart are where an hour on the train buys the most. What the chart doesn’t show is who is on these flights. A passenger flying Geneva–Zurich to change onto a long-haul flight doesn’t have the choice I’m calculating here, and neither does someone continuing from Frankfurt. My data can’t tell transfer passengers from anyone else.
A second estimate from the aircraft in my data
mobitool assumes an average European flight. The aircraft that actually flew to and from Zurich that day are known, so I tried a second estimate with OpenAP, the model from part 8: CO₂ per kilometre in cruise, divided by seats times load factor.
526 of the 581 Zurich flights have a type in the OpenSky aircraft database, 31 types. With seat numbers from OpenAP – plus six types from operator and manufacturer pages, as in the course notebook – and an 80 % load factor, the flight-weighted result is 69 g CO₂ per passenger-km. An A320: 9.6 kg CO₂ per km for 170 seats, 70 g.
That’s about a fifth of mobitool’s 319 g. The gap has reasons, and they’re worth knowing before trusting either number:
- Cruise only. The estimate is level flight at 36,000 feet. In OpenAP, an A320 climbing at 5,000 to 25,000 feet burns about two to four times as much fuel per kilometre as in cruise, with climb speeds and rates I chose. On a 300-km flight, a large part of the distance is climb and descent.
- Life cycle. mobitool’s 319 g are 259 g direct emissions plus 60 g for producing the fuel, building airports and aircraft.
- Non-CO₂ effects. mobitool’s flight factors match the “mobitool 2020” values, 318 g for short-haul and 238 g for long-haul. According to treeze (2021), Tab. 7.5, these are based on a factor of 2.0 on the CO₂ from burning kerosene – for contrails, NOx and the other effects from part 9. So roughly half of the direct 259 g are CO₂ itself, about 130 g, and the rest is the non-CO₂ share. Multiplying mobitool by another factor for non-CO₂ effects would count them twice.
- The model’s gaps. 12 of the 31 types have no estimate, among them the second most frequent one: the Airbus A220-300, 90 flights. That’s the same gap as in part 8.
130 g of CO₂ per passenger-km in real operations against 69 g in idealised cruise is a plausible relation, not a contradiction. For the comparison with the train, I use mobitool – it’s a published method with everything included and documented. OpenAP shows how much of that number is the aircraft in cruise, and how much is everything around it.
What I take from this
The positions only contribute one thing here: which flights actually happened. Everything else is reference data and assumptions – timetables, emission factors, detour factors, an airport overhead of two hours. That’s normal for this kind of question, and it’s why every number in this post comes with the assumption next to it.
What survives the assumptions: for a handful of cities, the train is close to the plane in time and far below it in CO₂. They’re 12 % of the Zurich flights in my data – a real share, not a majority. For most destinations, the train costs half a day.
What’s next
So far, the flights have been the subject. The next part turns it around and looks at the ground: who is overflown, how low and how often?
Data source
Flight data: The OpenSky Network – Matthias Schäfer, Martin Strohmeier, Vincent Lenders, Ivan Martinovic and Matthias Wilhelm. “Bringing Up OpenSky: A Large-scale ADS-B Sensor Network for Research”. In Proceedings of the 13th IEEE/ACM International Symposium on Information Processing in Sensor Networks (IPSN), pages 83–94, April 2014. doi:10.1109/IPSN.2014.6846743
Routes: adsbdb.com (flight route data © David Taylor & Jim Mason), used in aggregate only. Aircraft types: OpenSky Network aircraft database. Airports: OurAirports, public domain. Rail times: ÖBB timetable, queried on 20 October 2026 through the unofficial HAFAS endpoint behind fahrplan.oebb.at. Cross-check: national timetable from opentransportdata.swiss, through the Transport API and OJP 2.0, 4 November 2026. Emission factors: mobitool v3.1, EnergieSchweiz/PSI. Fuel model: OpenAP, TU Delft.
Useful Links
Emission factors
- Umweltrechner Verkehr (formerly mobitool) – EnergieSchweiz, with the factor table as data basis
- treeze (2021): Life Cycle Inventories of Air Transport Services – where the factor 2.0 for non-CO₂ effects comes from
Rail timetables
- opentransportdata.swiss – the open Swiss timetable data, and OJP 2.0, its journey planner interface
- Transport API – Opendata.ch, no key, connections within Switzerland
- hafas-client – open-source client for HAFAS backends, with the ÖBB profile
Model
- OpenAP – aircraft performance, fuel flow and seat numbers
Related posts
- Part 7 – routes – where the routes come from, and why some are wrong
- Part 8 – CO₂ – the fuel model and its gaps
- Part 9 – contrails – the non-CO₂ effect in mobitool’s factor
Related Articles

Live Flight Data Step by Step - Part 8 - How much CO₂ is flying over Switzerland?
A transponder doesn't send fuel flow. An open aircraft performance model turns type, altitude and speed into an estimate: about 8,800 tonnes of CO₂ over Switzerland in 22 hours – with a range of −18 to +24 % from one unknown alone, and a third of the traffic the model can't see.
Live Flight Data Step by Step - Part 12 - Who is overflown?
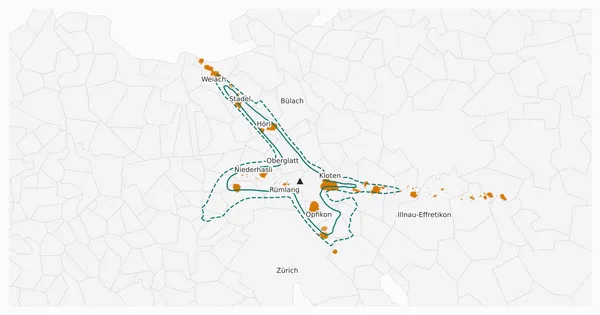
I put the low aircraft positions on the map of the Swiss municipalities and the BFS population grid. About 31,000 people near Zurich airport had at least ten aircraft pass below 3,000 ft (about 900 m) within 500 metres in one day. Most of them live inside the official noise contours – but not all.

Live Flight Data Step by Step - Part 10 - The 37 minutes Zurich didn't take off
Questions for a database of aircraft positions: when exactly did Zurich stop during the Skyguide fault, what happens at night, and how many aircraft only pass through? The press had 'almost an hour'. The positions have the minutes.
Comments
Comments are powered by giscus. You need a GitHub account to comment.