Live Flight Data Step by Step - Part 14 - The official numbers
 Stefan Koch
Everything in this series so far rests on one assumption: that the OpenSky receivers saw most of the traffic. I never checked it. The receivers are run by volunteers, ADS-B is a radio signal that needs line of sight, and not every aircraft sends it. So in this part I put my counts next to the official ones.
The flight data is the same as in parts 4 to 13: the Swiss feed from 20 October, 14:00 to 21 October, 11:59 Swiss time, one snapshot about every 35 seconds (2,262 in 22 hours). All times are Swiss time.
Where the official numbers come from
EUROCONTROL, the European organisation for air navigation, publishes the daily traffic of every larger European airport on its Aviation Intelligence Portal. One CSV file per year:
EC = "https://www.eurocontrol.int/performance/data/download/csv/"
p26 = fl.cached(EC + "airport_traffic_2026.csv", "eurocontrol_airport_traffic_2026.csv", max_age_days=7)
p19 = fl.cached(EC + "airport_traffic_2019.csv", "eurocontrol_airport_traffic_2019.csv", max_age_days=365)
The 2026 file is 6.3 MB, one row per airport and day. The columns are documented in the dataset definition. Two sets of counts:
FLT_DEP_1,FLT_ARR_1,FLT_TOT_1: IFR departures, arrivals and both together, from the Network Manager – EUROCONTROL’s central flow management, which processes the IFR flight plans in its area.FLT_DEP_IFR_2,FLT_ARR_IFR_2,FLT_TOT_IFR_2: the same, as reported by the airport operator.
IFR means instrument flight rules – airliners, cargo, most business jets. Light aircraft flying by sight (VFR) are not in it.
CREATE OR REPLACE TABLE apt_traffic AS
SELECT YEAR, CAST(MONTH_NUM AS INTEGER) AS MONTH_NUM, FLT_DATE, APT_ICAO, APT_NAME, STATE_NAME,
       FLT_DEP_1, FLT_ARR_1, FLT_TOT_1
FROM read_csv(['airport_traffic_2019.csv', 'airport_traffic_2026.csv'], union_by_name = true)
union_by_name matches the columns of the two files by name instead of position – a safeguard in case a future file changes the order. MONTH_NUM is stored as text (01, 02, …), hence the cast.
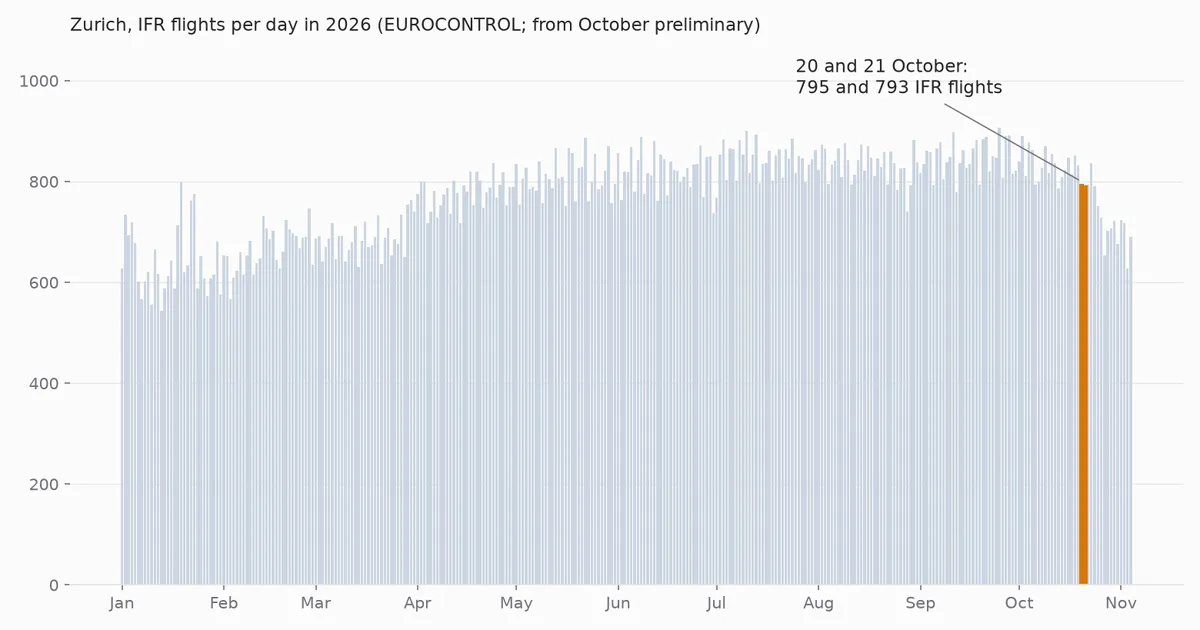
There’s one problem: when I downloaded the 2026 file on 5 November, it ended on 30 September. My two days aren’t in it.
The dashboard is fresher
EUROCONTROL also runs a daily traffic dashboard for airports, updated every day. It loads its numbers as a JSON file, and that file goes up to yesterday:
rows = json.loads(fl.cached("https://www.eurocontrol.int/Economics/tfc_apt_100_data.json",
                            "eurocontrol_apt100.json", max_age_days=1).read_text())
df = pd.DataFrame(rows[2:], columns=rows[0])   # row 0: column names, row 1: types, then the data as strings
On 5 November it had 113 airports, up to 4 November. The “About” box of the dashboard defines its count: total departing and arriving IFR flights, with circular flights counted twice.
This file isn’t a documented API, and its numbers are preliminary. So before I used it, I compared it with the official CSV for all 30 days of September at Zurich. It matches the Network Manager column FLT_TOT_1 exactly, on every day. Against the airport operator’s count, it’s 0 to 4 flights off per day. So the dashboard shows the same Network Manager numbers as the CSV, only earlier.
For my days:
| Zurich | IFR flights | same weekday 2025 | same weekday 2019 |
|---|---|---|---|
| Tuesday, 20 October | 795 | 775 | 744 |
| Wednesday, 21 October | 793 | 798 | 765 |
The dashboard compares with the closest similar day, so Tuesday 20 October 2026 sits next to Tuesday 21 October 2025 and Tuesday 22 October 2019.
Back to 2019?
Before the comparison, a look at the bigger picture, because the files invite it. 2019 was the last year before Covid. Per month, how many flights per day did 2026 have compared with the same month of 2019?
SELECT APT_ICAO AS airport, MONTH_NUM AS month,
       ROUND(100 * AVG(FLT_TOT_1) FILTER (WHERE YEAR = 2026)
                 / AVG(FLT_TOT_1) FILTER (WHERE YEAR = 2019), 1) AS pct_of_2019
FROM apt_traffic
WHERE APT_ICAO IN ('LSZH', 'LSGG', 'LFSB')
GROUP BY ALL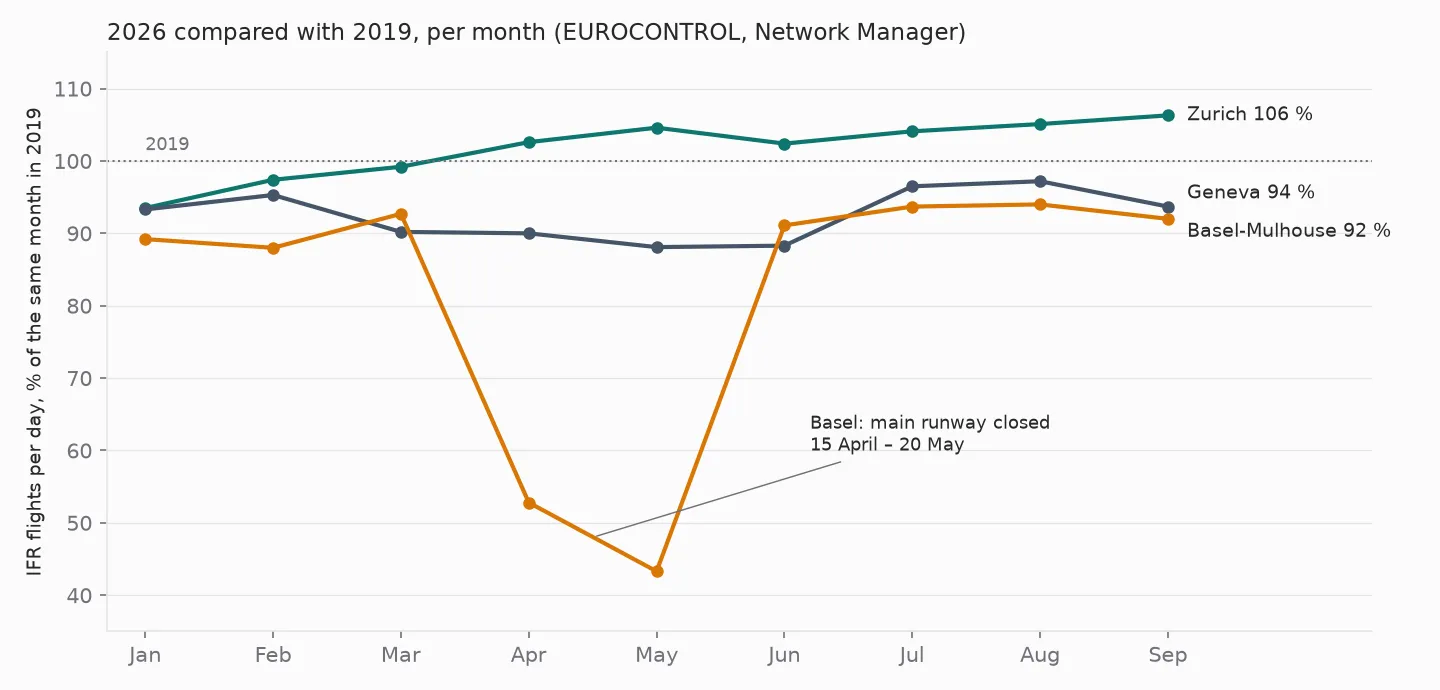
Zurich has been above 2019 since April: from January to September 770 IFR flights per day, against 755 in the same months of 2019. Geneva is at 92 %, Basel-Mulhouse at 82 %.
Basel’s dip in April and May isn’t a data error. The airport closed its main runway from 15 April to about 20 May for refurbishment. Only the much shorter secondary runway stayed open, and in passenger traffic practically only easyJet kept flying, with a reduced schedule (SRF). In the data, the flights drop from 190 on 14 April to 57 on 15 April, rise to 136 on 21 May and are back at 237 on 22 May. Without 15 April to 21 May, Basel is at 92 % of 2019 – as close to it as Geneva.
And where does Zurich stand in Europe? Ranked by IFR flights per day from January to September 2026, it’s number 12 of the 377 airports in the file. Istanbul leads with 1,501 per day, Geneva is number 30, Basel-Mulhouse number 78.
My count against the official one
Now the actual check. I count departures and arrivals at Zurich the same way as in part 10: different aircraft per hour within 15 km of the airport, in the air, below 6,000 ft, climbing or descending.
SELECT date_trunc('hour', timezone('Europe/Zurich', snapshot_time::TIMESTAMPTZ)) AS hour_local,
       COUNT(DISTINCT icao24) FILTER (WHERE flight_phase = 'climbing')   AS departures,
       COUNT(DISTINCT icao24) FILTER (WHERE flight_phase = 'descending') AS arrivals
FROM near_lszh
GROUP BY ALL
EUROCONTROL only has whole days, and my window is two half days. But together the two halves cover almost a full operating day: Tuesday 14:00 to 22:59 and Wednesday 06:00 to 11:59 – 15 of the 17 hours from 06:00 to 23:00. Only 12:00 to 13:59 is missing.
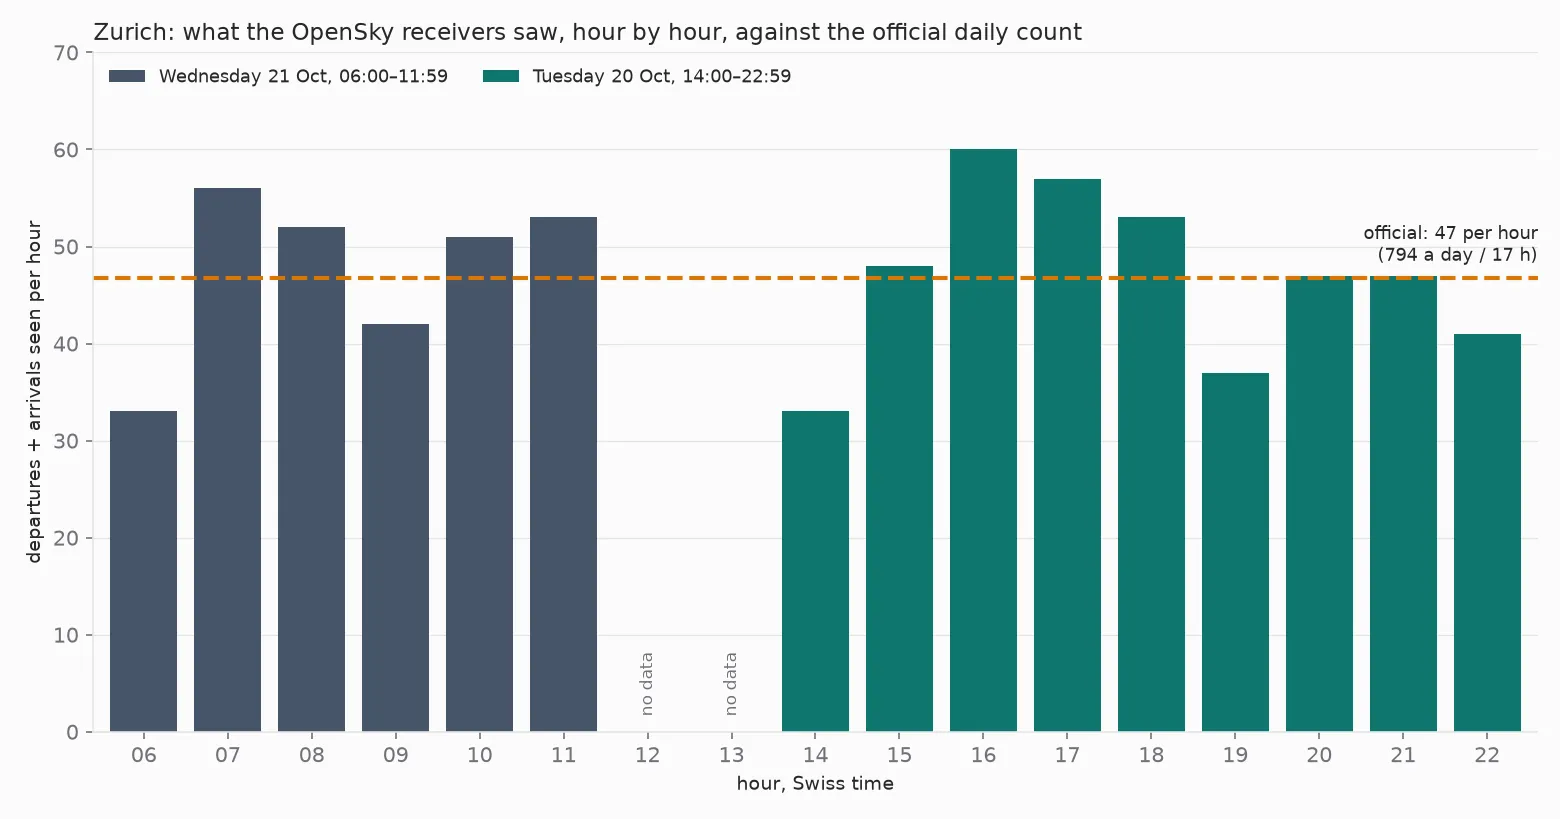
In those 15 hours I see 710 movements, 47 per hour. The official 795 and 793 flights, spread over 17 operating hours, are also 47 per hour. Scaled to 17 hours, my count gives 805 movements a day – 101 % of the official number.
That looks too good, and it is a bit too good. Three things in my count push it up or down:
- Double counts. An aircraft that descends from 14:58 to 15:02 counts at 14:00 and at 15:00. I found 20 such cases. If I count each continuous climb or descent only once, I get 692 movements instead of 710, and the estimate drops to 784 a day – 99 %.
- Flights EUROCONTROL doesn’t count. 22 of the 692 climbs and descents have a registration instead of a flight number as callsign – mostly Swiss (
HB…), German (D…) and American (N…) aircraft, from light aircraft to business jets. Some of them fly IFR, some by sight. The VFR ones are in my count but not in the official one. - Flights I miss. An aircraft without ADS-B, or one that no receiver heard, isn’t in my count at all. In Europe, ADS-B is mandatory for IFR flights by fixed-wing aircraft over 5,700 kg or faster than 250 knots, if their airworthiness certificate was first issued on or after 7 June 1995 (EASA). That covers practically every airliner. Older or lighter aircraft can fly IFR without it.
And then the estimate itself: I assume the two missing midday hours and the few flights after 23:00 average out at 47 per hour. After 23:00 I saw 11 movements on Tuesday night, and none from 03:00 until my Wednesday hours began at 06:00.
So the honest result is: at Zurich, below 6,000 ft, my count is within a few percent of the official one. Whether that’s because almost nothing is missing, or because a few missing flights and a few extra VFR flights cancel out, this comparison can’t tell. For that I’d need a list of the individual flights, and EUROCONTROL doesn’t publish one.
What I take from this
For the questions of this series – how many flights, which airlines, when, where – the sample is good enough at Zurich. I’d be more careful with places the receivers see less well: an airport in an Alpine valley, or low flights behind a hill. Coverage isn’t one number. It depends on place, altitude and aircraft.
The check also showed me how easily a good number hides a problem. My first result, 101 %, came from a method that counts some aircraft twice. Without the second look, I would have reported a match that was partly luck.
And the official data has its own small traps: the CSV is a month or more behind, the fresh numbers sit in an undocumented dashboard file, and a five-week runway closure turns into a strange dip if you don’t know about it.
What’s next
The next part goes back to the 37 minutes of the Skyguide fault: what did the arriving aircraft do while nothing took off? And can positions alone show holding patterns and go-arounds?
Data source
Flight data: The OpenSky Network – Matthias Schäfer, Martin Strohmeier, Vincent Lenders, Ivan Martinovic and Matthias Wilhelm. “Bringing Up OpenSky: A Large-scale ADS-B Sensor Network for Research”. In Proceedings of the 13th IEEE/ACM International Symposium on Information Processing in Sensor Networks (IPSN), pages 83–94, April 2014. doi:10.1109/IPSN.2014.6846743
Airport traffic: Source: EUROCONTROL – Aviation Intelligence Portal (airport traffic 2019 and 2026) and the daily traffic dashboard (preliminary). Free for non-commercial use with EUROCONTROL as the source, see the disclaimer. Airport reference point: OurAirports, public domain.
Useful Links
Official traffic data
- EUROCONTROL: airport traffic dataset – column definitions, Network Manager vs. airport operator
- EUROCONTROL: data download – the yearly CSV files
- EUROCONTROL: daily traffic variation, airports – the dashboard, with “About” and “Download”
Context
- SRF: what the closed runway at EuroAirport means for passengers – the closure in spring 2026 (German)
- EASA: ADS-B and Mode S requirements – which aircraft must send ADS-B
Related posts
- Part 10 – analysis – the counting method, and the 37 minutes
- Part 13 – the weather at Kloten – the previous part
Related Articles
Live Flight Data Step by Step - Part 15 - Holdings, go-arounds and echoes
During the 37 minutes without take-offs, the arrivals at Zurich landed as if nothing had happened: no holding, no go-around, normal approach times. My go-around detector found six go-arounds in 22 hours anyway – all six were echoes in the data.
Live Flight Data Step by Step - Part 13 - The weather at Kloten
I put the 10-minute measurements of the MeteoSwiss station at Zurich airport next to the take-offs and landings. In 22 hours the weather barely moved the traffic – the one big dip was the Skyguide fault. The wind fits the runway change that part 12 couldn't explain – but it doesn't prove the cause.
Live Flight Data Step by Step - Part 12 - Who is overflown?
I put the low aircraft positions on the map of the Swiss municipalities and the BFS population grid. About 31,000 people near Zurich airport had at least ten aircraft pass below 3,000 ft (about 900 m) within 500 metres in one day. Most of them live inside the official noise contours – but not all.
Comments
Comments are powered by giscus. You need a GitHub account to comment.