Live Flight Data Step by Step - Part 13 - The weather at Kloten
 Stefan Koch
Part 12 ended with an open question. On Wednesday morning, from about 10:00, the aircraft landed from the east – not the usual daytime concept, and my position data didn’t say why. This part brings in the weather measured at the airport itself.
The flight data is the same as in parts 4 to 12: the Swiss feed from 20 October, 14:00 to 21 October, 11:59 Swiss time. All times in this post are Swiss time (UTC+2 on those days) unless they say UTC.
Where the weather data comes from
Three sources, all free and without an API key.
The MeteoSwiss station Kloten. MeteoSwiss runs an automatic weather station at Zurich airport: KLO, “Zürich / Kloten”, 426 m above sea level, measuring since 1935. It stands about 2.6 km north-north-west of the airport reference point. Since May 2025 MeteoSwiss has been publishing the measurements as open data, as plain files on the geodata platform of the federal government. For each station there are two CSV files with one row every 10 minutes:
base = "https://data.geo.admin.ch/ch.meteoschweiz.ogd-smn"
klo_recent = fl.cached(f"{base}/klo/ogd-smn_klo_t_recent.csv", "meteoswiss_klo_t_recent.csv", 1)
klo_now    = fl.cached(f"{base}/klo/ogd-smn_klo_t_now.csv", "meteoswiss_klo_t_now.csv", 10 / 1440)
klo_params = fl.cached(f"{base}/ogd-smn_meta_parameters.csv", "meteoswiss_meta_parameters.csv", 30)
recent runs from 1 January until yesterday (about 6 MB), now has the latest values and is updated every 10 minutes. fl.cached is the small helper from the earlier parts: it downloads a file only if it’s missing or older than the given number of days – one day for recent, ten minutes for now.
The files have a ; as separator and one column per parameter, 32 in all. The column names are codes, and the third file explains them. I use eight: temperature (tre200s0), humidity (ure200s0), wind direction (dkl010z0), mean wind (fu3010z0), gust peak (fu3010z1), precipitation (rre150z0), pressure reduced to sea level, QNH (pp0qnhs0) and global radiation (gre000z0). The wind is a 10-minute mean, the gust the highest one-second value in the 10 minutes.
Two details of the format matter. The timestamps are in UTC as 20.10.2026 14:00. And for 10-minute values, the timestamp marks the end of the interval: 14:10 means 14:00 to 14:10.
The METAR. Pilots don’t read MeteoSwiss files – they get the METAR, a coded weather report for the airport. Zurich issues one every 30 minutes, at :20 and :50. A real one from my afternoon:
METAR LSZH 201220Z 04009KT 9999 FEW016 13/09 Q1010 NOSIGWind from 040° at 9 knots, visibility 10 km or more, few clouds at 1,600 ft, 13 °C, dew point 9 °C, pressure 1010 hPa, no significant change expected. The wind is the mean of the 10 minutes before the report, rounded to 10° and whole knots.
The METARs come from the API of aviationweather.gov, the aviation weather service of the US National Weather Service. The course notebook asks for the last 72 hours, which is fine while the collector runs. My window is two weeks old, so I added the date parameter – the end of the period – and asked for the 24 hours before it:
url = "https://aviationweather.gov/api/data/metar"
params = {"ids": "LSZH", "format": "json", "hours": 24, "date": "2026-10-21T10:00:00Z"}
That returned 48 reports, from 20 October 10:20 to 21 October 09:50 UTC. A small parser in the course code, enrichment/metar.py, turns them into a table with one column per field.
Open-Meteo. The third source is the weather model from part 9: hourly temperature and wind at the station’s position, from the forecast API, which also delivers past days.
q = {"latitude": 47.480, "longitude": 8.536, "hourly": "temperature_2m,wind_speed_10m,wind_direction_10m",
     "start_date": "2026-10-20", "end_date": "2026-10-21", "timezone": "GMT"}
Open-Meteo answers with the grid point it used: 47.480 N, 8.523 E, about 1 km west of the station.
Into DuckDB
Both station files go into one table, weather.kloten_10min, with readable column names:
CREATE OR REPLACE TABLE weather.kloten_10min AS
SELECT DISTINCT reference_timestamp AS time_utc, tre200s0 AS temp_c, fu3010z0 AS wind_kmh, ...
FROM read_csv(['ogd-smn_klo_t_recent.csv', 'ogd-smn_klo_t_now.csv'], sep = ';',
              sample_size = -1, timestampformat = '%d.%m.%Y %H:%M')
Three lines in it are there because something went wrong without them:
- DuckDB doesn’t recognise
20.10.2026 14:00as a timestamp. Withouttimestampformat, the column stays text. - DuckDB guesses column types from a sample of rows. A parameter that happens to be empty or whole-numbered in the sample gets the wrong type.
sample_size = -1reads all rows first. - The two files can overlap around midnight, so
DISTINCT.
The result: 44,414 rows since 1 January. MeteoSwiss writes its files in Windows-1252, not UTF-8. For the data files that doesn’t matter, they’re plain numbers. The parameter file needs encoding = 'latin-1', which decodes its ° the same way.
Does the weather move the traffic?
Per 10 minutes, I count the departures and arrivals at Zurich the same way as in part 10: different aircraft within 15 km of the airport, below 6,000 ft, climbing or descending. Next to it, the station’s wind, gusts and precipitation for the same 10 minutes.
Two things need care. The station stamps the end of the 10 minutes, DuckDB’s time_bucket the start – so the join adds 10 minutes:
JOIN weather.kloten_10min w ON w.time_utc = s.t_utc + INTERVAL 10 MINUTEAnd a zero has to be a real zero. If the collector wasn’t running, there are no aircraft either. So I also count the snapshots per 10 minutes and keep only 10-minute slots with at least five, and only 06:00 to 22:59 – the night curfew isn’t weather either. That leaves 90 slots, and all of them have data.
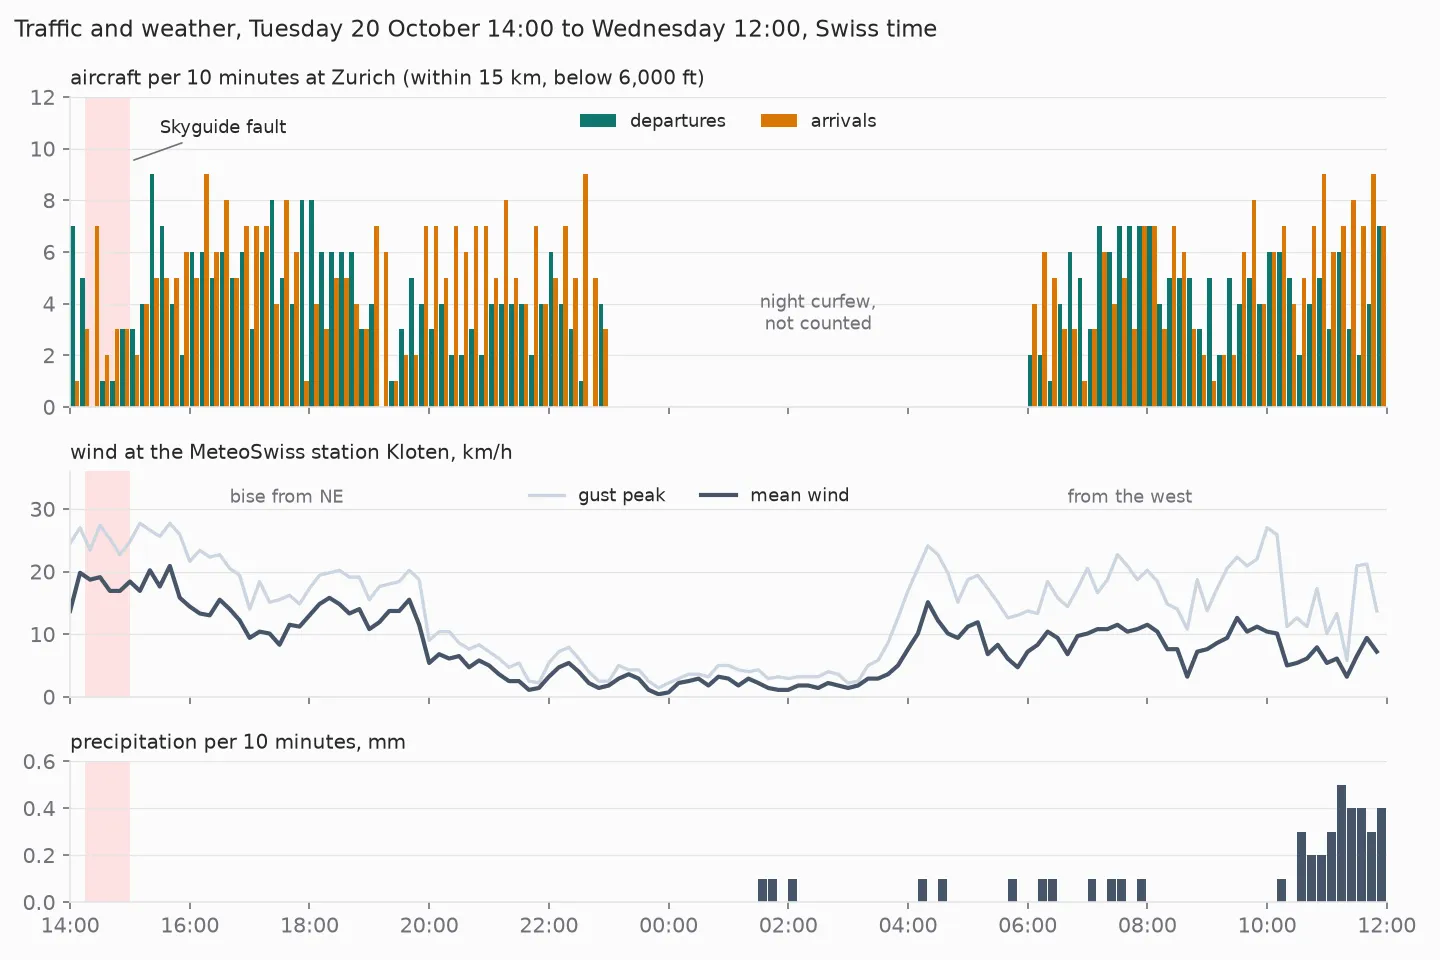
The weather in those 22 hours was unspectacular. On Tuesday afternoon a bise blew from the north-east, with a mean wind of up to 21 km/h and gusts up to 28 km/h. The night was almost calm. On Wednesday the wind came from the west, and from 10:30 it rained – 4.3 mm in the whole window, most of it in the last 90 minutes. The temperature stayed between 9 and 14 °C.
The traffic didn’t care much. The correlation between the gusts and the departures per 10 minutes is +0.25, with the arrivals −0.18. Both are weak, and the positive one doesn’t mean wind brings take-offs: the windy hours were Tuesday afternoon, which was also busy.
One counting detail: an aircraft that climbs for more than 10 minutes inside the 15 km circle counts in two slots. The numbers per 10 minutes describe activity, not unique flights.
The dip that wasn’t weather
The clearest drop in the chart is on Tuesday from 14:20 to 15:00: 0, 1, 1 and 3 departures per 10 minutes, against 4.6 on average from 15:00 to 21:00. That’s the Skyguide fault from part 10, with 37 minutes without an airline take-off.
The weather at that time: 18 km/h of bise, no rain, and the METAR quoted above – visibility 10 km or more, few clouds. Nothing in the weather explains the gap. That’s worth keeping in mind for any analysis of this kind: the biggest event in my window had a technical cause, and from the positions alone it looks just like a weather disruption would.
Station, METAR, model: do they agree?
The METAR and the station measure at the same airport, both as 10-minute means, and both stamp the end of the interval. So a METAR at 12:20 UTC joins the station row with time_utc 12:20 UTC.
Wind directions need one trick. They’re circular: 350° and 10° are 20° apart, not 340°. This folds every difference into −180 to +180:
((m.wind_dir_deg - w.wind_dir_deg + 540) % 360) - 180 AS dir_diff_deg| Comparison | Reports / hours | Temperature | Wind speed | Wind direction |
|---|---|---|---|---|
| METAR vs. station | 48 | 0.3 °C (max 0.7) | 1.9 km/h | 6° (median, 33 reports) |
| Open-Meteo vs. station | 22 | 0.3 °C | 2.5 km/h | – |
Mean absolute differences, unless noted.
The METAR and the station agree closely. The remaining differences fit the rounding: the METAR gives whole degrees Celsius, whole knots (1 kt = 1.852 km/h) and steps of 10°, the station gives tenths. 15 of the 48 METARs report the direction as VRB – variable, usually at low wind speeds – and have no direction to compare. I don’t know whether the METAR uses the same anemometer as the MeteoSwiss station.
That Open-Meteo is just as close in temperature surprised me. A model gives one value per grid cell, and I didn’t choose a model, so Open-Meteo picked one – which one, the answer doesn’t say. For these 22 calm hours at one place on the Plateau, the model was good enough. That says nothing about a thunderstorm, fog or a mountain valley.
Which way they take off
Aircraft take off into the wind whenever possible: a headwind means a lower ground speed at lift-off and a shorter take-off run. Zurich has three runways, each usable in both directions. The operating concepts of the airport set which runway is used when: on weekdays, take-offs on 28 or 16 during the day, on 32 or 34 in the evening from 21:00. Two weather exceptions are listed: with strong westerly wind, take-off on 32 and landing on 28; with bise, take-off on 10 and landing on 14 during the day.
For each departure I take the first position within 8 km of the airport, below 4,000 ft, while climbing, and put the station’s wind next to it. The headwind component is the wind speed times the cosine of the angle between wind and direction of flight:
ROUND(w.wind_kmh * COS(RADIANS(w.wind_dir_deg - d.heading)), 1) AS headwind_kmhPositive means headwind, negative tailwind. The wind direction is where the wind comes from, so a heading equal to the wind direction means flying straight into it. The runway I assign roughly by the heading: 120–200° is 16 (or 14), 250–300° is 28, 300–340° is 32 (or 34). That’s not exact; a later part matches the tracks to the real runway ends.
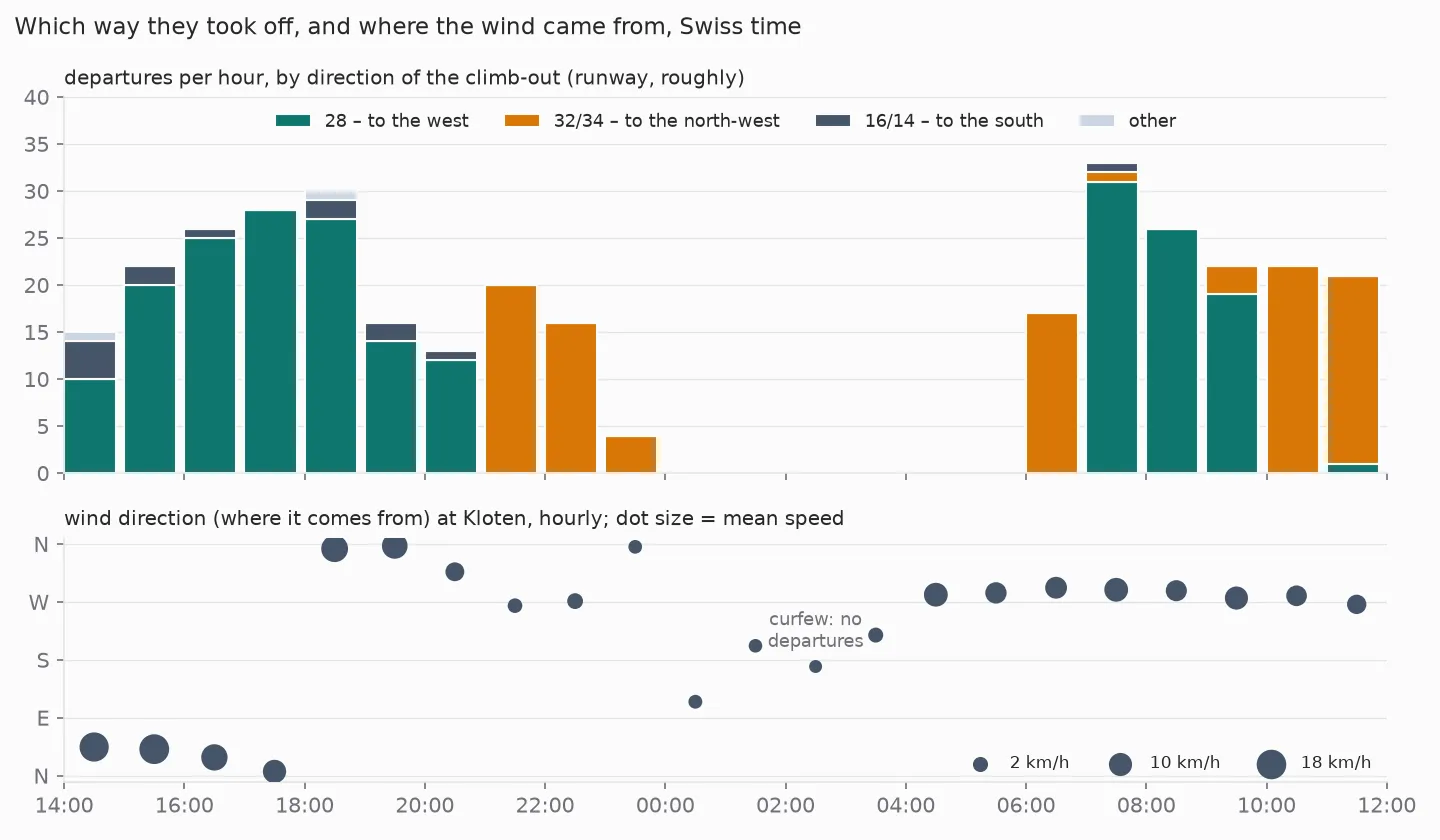
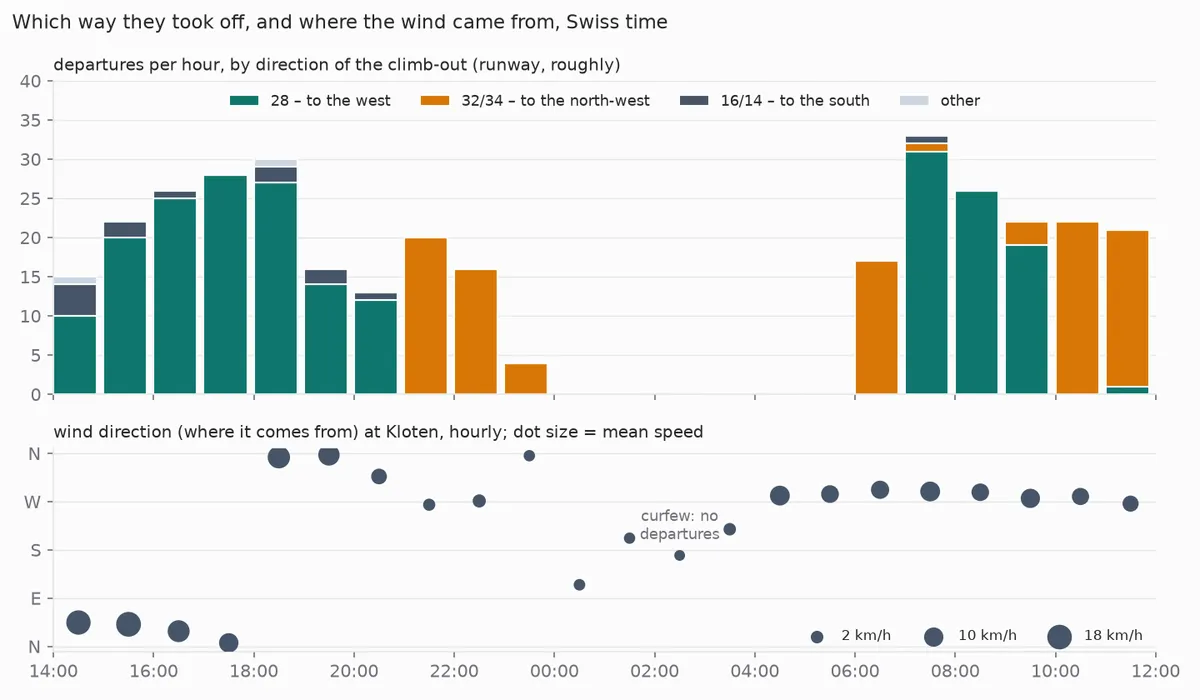
331 departures: 213 to the west on 28, 103 to the north-west on 32 or 34, 13 to the south, 2 other. The pattern follows the clock more than the wind. At 21:00 the take-offs switch from 28 to 32/34, exactly when the evening concept starts. At 06:00 they’re on 32/34, from 07:00 on 28 again.
Tuesday: take-off with the wind in the back
On Tuesday afternoon the bise blew from the north-east, and the aircraft took off to the west on 28 – with the wind behind them. Between 14:00 and 18:00, 84 % of the 83 departures on 28 had a tailwind component – averaged over all 83, 5.4 km/h, at most 15.8 km/h. The bise concept, with take-offs on 10 to the east, wasn’t used: of the 91 departures in those four hours, 83 went west on 28, 7 south on 16 and 1 in another direction.
Is that unusual? ICAO’s rule of thumb for choosing a runway for noise reasons allows a tailwind of up to 5 knots (about 9 km/h) including gusts. I found that in a position paper of the pilots’ federation IFALPA, which cites ICAO’s PANS-ATM. Zurich’s own limit I didn’t find. And my comparison is rough: I use the 10-minute mean at the station, not the wind on the runway, and not the gusts.
Wednesday: the answer to part 12
From 10:00 on Wednesday, the take-offs switch from 28 to 32/34, and – as part 12 showed – the landings come from the east, on 28. That’s the evening concept in the morning. The airport’s page names the case: the east concept applies on weekdays from 21:00, and with westerly wind “auch tagsüber” – during the day as well.
The station measured exactly that: wind from about 265 to 295° since 04:00, 6 to 11 km/h on average per hour, with gusts up to 27 km/h between 10:00 and 11:00, and rain from 10:30. So the wind fits. Whether it was the reason – or the forecast, the gusts, the rain or something else – the data doesn’t say. “Strong” westerly wind sounds like more than 7 km/h on average, and the switch came about six hours after the wind had turned west.
What I take from this
The MeteoSwiss station is the easiest data source of the series so far: no key, no rate limit, two files, a documented format. The only traps were the timestamp format and that the timestamp marks the end of the interval.
In these 22 hours the weather barely moved the traffic. The biggest disruption had a technical cause, and runway changes followed the clock more than the wind – with one exception on Wednesday that the wind explains plausibly, but not with certainty. Weather becomes interesting with fog, thunderstorms, snow or strong bise, and none of that happened on my day.
What’s next
My data is a sample: what the receivers of the OpenSky Network picked up. The next part puts it next to the official traffic numbers of EUROCONTROL.
Data source
Flight data: The OpenSky Network – Matthias Schäfer, Martin Strohmeier, Vincent Lenders, Ivan Martinovic and Matthias Wilhelm. “Bringing Up OpenSky: A Large-scale ADS-B Sensor Network for Research”. In Proceedings of the 13th IEEE/ACM International Symposium on Information Processing in Sensor Networks (IPSN), pages 83–94, April 2014. doi:10.1109/IPSN.2014.6846743
Weather station: Source: MeteoSwiss, station Zürich / Kloten (KLO), open data under CC BY 4.0. METAR: aviationweather.gov, US National Weather Service, public domain. Weather model: Open-Meteo, CC BY 4.0. Airport and runways: OurAirports, public domain.
Useful Links
Weather data
- MeteoSwiss open data: download – file names, format, timestamps, encoding
- MeteoSwiss station list – all automatic stations with coordinates
- aviationweather.gov Data API – METAR and other reports, with the
dateparameter - Open-Meteo: forecast API – also for past days
Runways and wind
- Flughafen Zürich: operating concepts – which runway when, and the weather exceptions
- IFALPA: tailwind operations – with the ICAO limits for runway selection
Related posts
- Part 9 – contrails – Open-Meteo at cruising altitude
- Part 10 – analysis – the Skyguide fault, minute by minute
- Part 12 – who is overflown – the previous part, and the open question about Wednesday
Related Articles
Live Flight Data Step by Step - Part 15 - Holdings, go-arounds and echoes
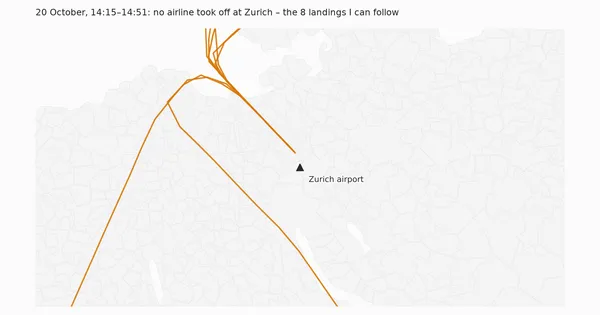
During the 37 minutes without take-offs, the arrivals at Zurich landed as if nothing had happened: no holding, no go-around, normal approach times. My go-around detector found six go-arounds in 22 hours anyway – all six were echoes in the data.
Live Flight Data Step by Step - Part 14 - The official numbers
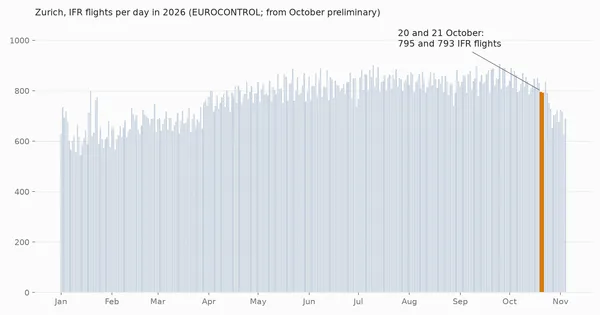
My flight data is a sample: what the OpenSky receivers picked up. EUROCONTROL counts every IFR flight. For Zurich on 20 and 21 October, my estimate lands within a few percent of the official count – but the check is rougher than that number suggests.
Live Flight Data Step by Step - Part 12 - Who is overflown?
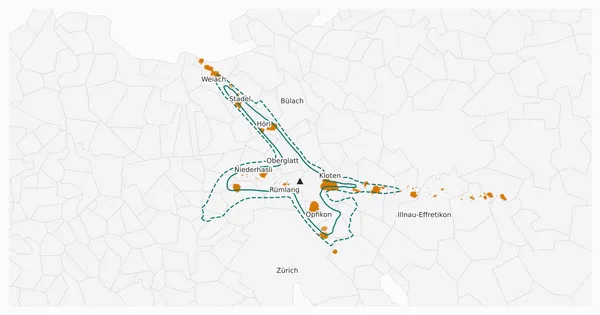
I put the low aircraft positions on the map of the Swiss municipalities and the BFS population grid. About 31,000 people near Zurich airport had at least ten aircraft pass below 3,000 ft (about 900 m) within 500 metres in one day. Most of them live inside the official noise contours – but not all.
Comments
Comments are powered by giscus. You need a GitHub account to comment.