Live Flight Data Step by Step - Part 17 - Looking back, and the code
 Stefan Koch
Sixteen parts ago I asked OpenSky for every aircraft over Switzerland: one API call, ten lines of Python. This is the last part of the series. It looks back on what came out of that call, what I’d change, and what I didn’t get to. And it links the code.
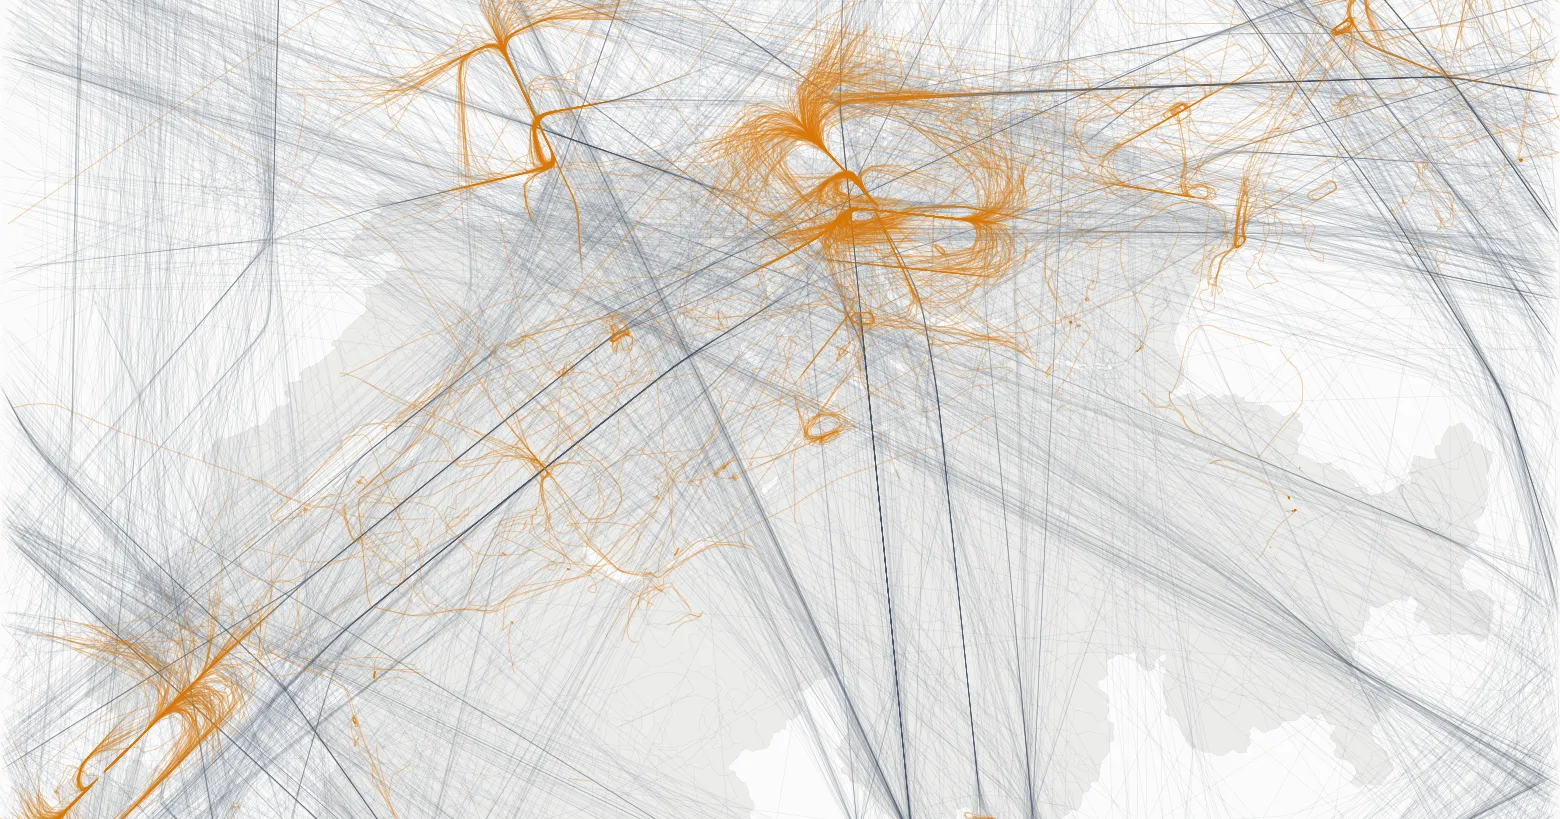
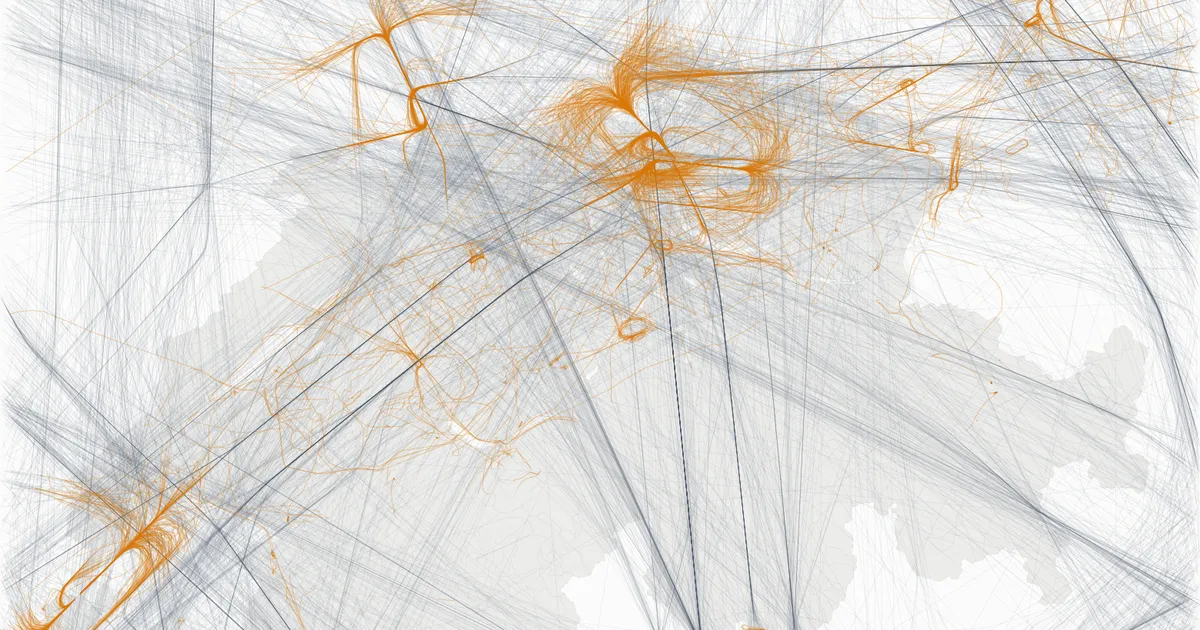
That’s all of it: 144,614 airborne positions of 2,521 aircraft in the box around Switzerland, grey above 10,000 ft, orange below.
What came out
All the analyses ran on the same 22 hours, 20 October 14:00 to 21 October 11:59 Swiss time, one snapshot about every 35 seconds:
- The pipeline (parts 1–6): bronze keeps every OpenSky answer as it arrived, silver turns it into typed positions, gold answers questions. A backfill from the archive on my home server filled the twelve hours my laptop slept.
- Routes (part 7): my own positions contradict almost a quarter of the routes a free database gives for the callsigns.
- CO₂ (part 8): about 8,800 tonnes over Switzerland in 22 hours – with a range of −18 to +24 % from the unknown aircraft mass alone, and a third of the traffic the model can’t see.
- Contrails (part 9): a third of the cruise positions leave a persistent one – or fewer than 4 %, if the humidity is one rounding step lower.
- The Skyguide fault (parts 10, 13, 15): 37 minutes without a single airliner taking off at Zurich. The landings went on, without holdings, go-arounds or longer approaches.
- Plane or train (part 11): for six destinations, the train takes at most an hour longer door to door.
- Who is overflown (part 12): about 31,000 people near Zurich airport had at least ten aircraft pass low and close in one day.
- The official numbers (part 14): my count for Zurich lands within a few percent of EUROCONTROL’s – and the check is rougher than that number suggests.
- The app (part 16): a live map that collects, analyses and draws in one process.
What worked
Checking against a second source. The results I trust most are the ones I could hold against something independent. The routes against my own positions. My counts against EUROCONTROL. The weather at Kloten against the runway in use. Every go-around against a plot of the track. Two of these checks changed a result completely: 830 routes turned out to be contradicted by the positions, and six go-arounds turned out to be echoes.
Keeping the raw answers. Bronze stores every OpenSky answer unchanged, and storing the same answer twice changes nothing. That made the backfill in part 4 simple, and a mistake in silver or gold never cost data: both can be rebuilt from bronze.
A laptop is enough. DuckDB and marimo ran everything, from the collector to the noise analysis, on one laptop, in one database file of 85 megabytes for the 22 hours. No cluster, no cloud account for the analyses.
Writing it down. Explaining each step in a post forced me to check each number again before it went out. More than one sentence changed on the way, because the data didn’t support it.
What didn’t
22 hours is a sample, not a season. It answered questions about one afternoon and one morning. It can’t answer whether school holidays fill the airport, how often Zurich changes runways in a month, or whether the Skyguide fault was unusual. I dropped the planned parts on holidays and on finding disruptions automatically for that reason.
The data is thin where it gets interesting. Close to the ground, the receivers lose aircraft – part 15 found 220 landings in 22 hours, where EUROCONTROL’s count means about 400 arrivals a day. OpenSky’s aircraft database has a build year for 67 of 2,318 airline aircraft in my data. A third of the traffic has no aircraft type the CO₂ model knows.
Estimates with wide ranges. CO₂ and contrails are model results with assumptions I can’t check from positions: the mass of the aircraft, the humidity at its altitude. I gave the ranges. They are wide.
The same traps, again. Time zones came up in part 2, again in parts 5 and 6, and once more in the app’s cursors. “The nearest airport” sent Zurich arrivals to an air base in part 6, and the same idea caused trouble again in the route check and in part 15.
What I’d do differently
- Collect for weeks before analysing. The archive on my home server ran for three days. Many of the questions I had to drop need weeks or months. I’d start the collector long before the first analysis – a small always-on machine and some disk space are enough.
- Write the checks first. The comparison with EUROCONTROL came in part 14. It would have been more useful in part 6, as a test that runs every time the pipeline changes.
- One time zone rule, from the start. Store UTC, convert to Swiss time only for display, and set it on every connection and cursor. I knew the rule. I didn’t apply it everywhere.
- A smaller app. The map grew with every part, to 1,500 lines in one file. I’d split it by tab early.
What’s left to analyse
The data could answer much more than this series did. Some of it needs a longer collection, some only time:
- Seasons and holidays. Does traffic follow school holidays, and which destinations grow in winter? This needs months of data – or EUROCONTROL’s daily counts, which go back years (part 14).
- Runways and wind over time. Part 13 found one runway change and a wind that fits it. With a few months, you could count how often the bise turns Zurich around, and at what wind speed.
- Disruptions, found automatically. The 37 minutes were known from the press. A detector that finds such gaps on its own – departures falling to zero while landings go on – needs a normal day to compare with, and many of them.
- Contrails with a real model. Part 9 used the simple Schmidt-Appleman criterion. The open-source pycontrails library includes CoCiP, a model that follows each contrail as it ages and estimates its radiative forcing – how much it warms. The course has a notebook for it; I didn’t write the part.
- Noise. Part 12 counted aircraft over people, not decibels. Next to measured noise levels, the count would show how far it is from what people actually hear.
- Beyond Switzerland. With the world feed, the detours of part 7 could be measured on whole flights, for example around closed airspace.
- The receivers themselves. Where does OpenSky lose aircraft, and at what altitude? Part 15 found echoes after the landing. I don’t know where they come from.
The code
The course project is now public: github.com/stefanko-ch/live-flight-tracking, under the MIT licence. I built it for a course at the Lucerne University of Applied Sciences and Arts (HSLU) in October 2026, and it’s the code behind every part of this series:
- 20 marimo notebooks, each as an exercise with gaps and checks, and as a solution;
flightlab.pywith the bronze, silver and gold steps, and the collector;- the analyses as plain Python modules in
enrichment/; - the app from part 16.
git clone https://github.com/stefanko-ch/live-flight-tracking.git
cd live-flight-tracking
uv sync
uv run start.py
The repository contains no flight data. The archive I used for the series is not public. OpenSky’s terms of use license the data for non-profit research and education, and don’t allow passing it on. You collect your own – and read the terms first: operational use of the API, in a live product or an automated system, needs a written license from OpenSky. Without an account, that’s about four hours a day; with a free OpenSky account and API client, a whole day. The notebooks about the Skyguide fault then look at your own last hours instead of 20 October.
Thanks
To the OpenSky Network and its volunteers, whose receivers made every position in this series. To the people behind OurAirports, OpenFlights, adsbdb, OpenAP and the open data of MeteoSwiss, the BFS and EUROCONTROL. And to the students of the course.
Data sources
Flight data: The OpenSky Network – Matthias Schäfer, Martin Strohmeier, Vincent Lenders, Ivan Martinovic and Matthias Wilhelm. “Bringing Up OpenSky: A Large-scale ADS-B Sensor Network for Research”. In Proceedings of the 13th IEEE/ACM International Symposium on Information Processing in Sensor Networks (IPSN), pages 83–94, April 2014. doi:10.1109/IPSN.2014.6846743
All other sources are named in the part that uses them, and in the README of the repository.
The whole series
- OpenSky Network and the first API call
- Storing raw answers in a DuckDB bronze layer
- A collector that keeps going
- Filling the gaps from Cloudflare R2
- Silver, and the trap a backfill sets
- Gold, and the airport that steals Zurich’s arrivals
- Routes, and why almost a quarter are wrong
- How much CO₂ is flying over Switzerland?
- Contrails, and the percentage point that decides
- The 37 minutes Zurich didn’t take off
- Plane or train, and what an hour is worth
- Who is overflown?
- The weather at Kloten
- The official numbers
- Holdings, go-arounds and echoes
- The app
Related Articles
Live Flight Data Step by Step - Part 16 - The app
Fifteen parts of notebooks end in two small apps: a marimo notebook that runs as a dashboard, and a live map that collects, analyses and draws in one process. How they're built, and where DuckDB's single writer shaped the design.
Live Flight Data Step by Step - Part 15 - Holdings, go-arounds and echoes
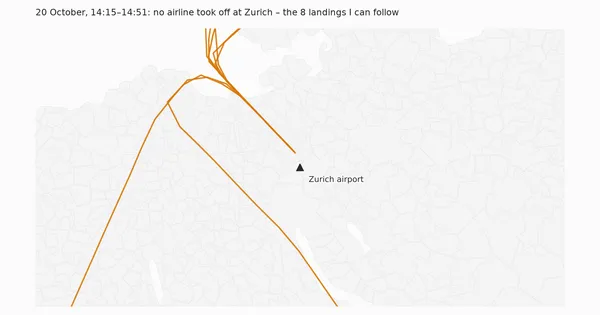
During the 37 minutes without take-offs, the arrivals at Zurich landed as if nothing had happened: no holding, no go-around, normal approach times. My go-around detector found six go-arounds in 22 hours anyway – all six were echoes in the data.
Live Flight Data Step by Step - Part 1 - OpenSky Network and the first API call
Where live flight data comes from, how ADS-B and the OpenSky Network work, and how to fetch every aircraft over Switzerland with ten lines of Python.
Comments
Comments are powered by giscus. You need a GitHub account to comment.